Download PDF
Download page Database Query Details Window.
Database Query Details Window
Once you have identified the statements on the Database Queries window that are spending the most amount of time in the database, you can dig down deeper for details that can help you tune those SQL statements. The database instance Query Details window displays details about the query selected on the Database Queries window.
Access the Database Query Details Window
To access the Database Query Details Window
- To view a database's query details, click the name of the database.
- Click the Queries tab.
- Select a query and click View Query Details.
Features of the Database Query Details Window
On the Database Query Details window you can:
- Click Execution Plan to view an explanation plan for the query you selected on the Queries window if it was a SELECT query.
- Click on the graphs to see metrics for that specific point in time.
Click the down arrow next to the database Collector name at the top of the page to choose to view the query details of a different database Collector.
On the Database Query Details window you can see the following information:
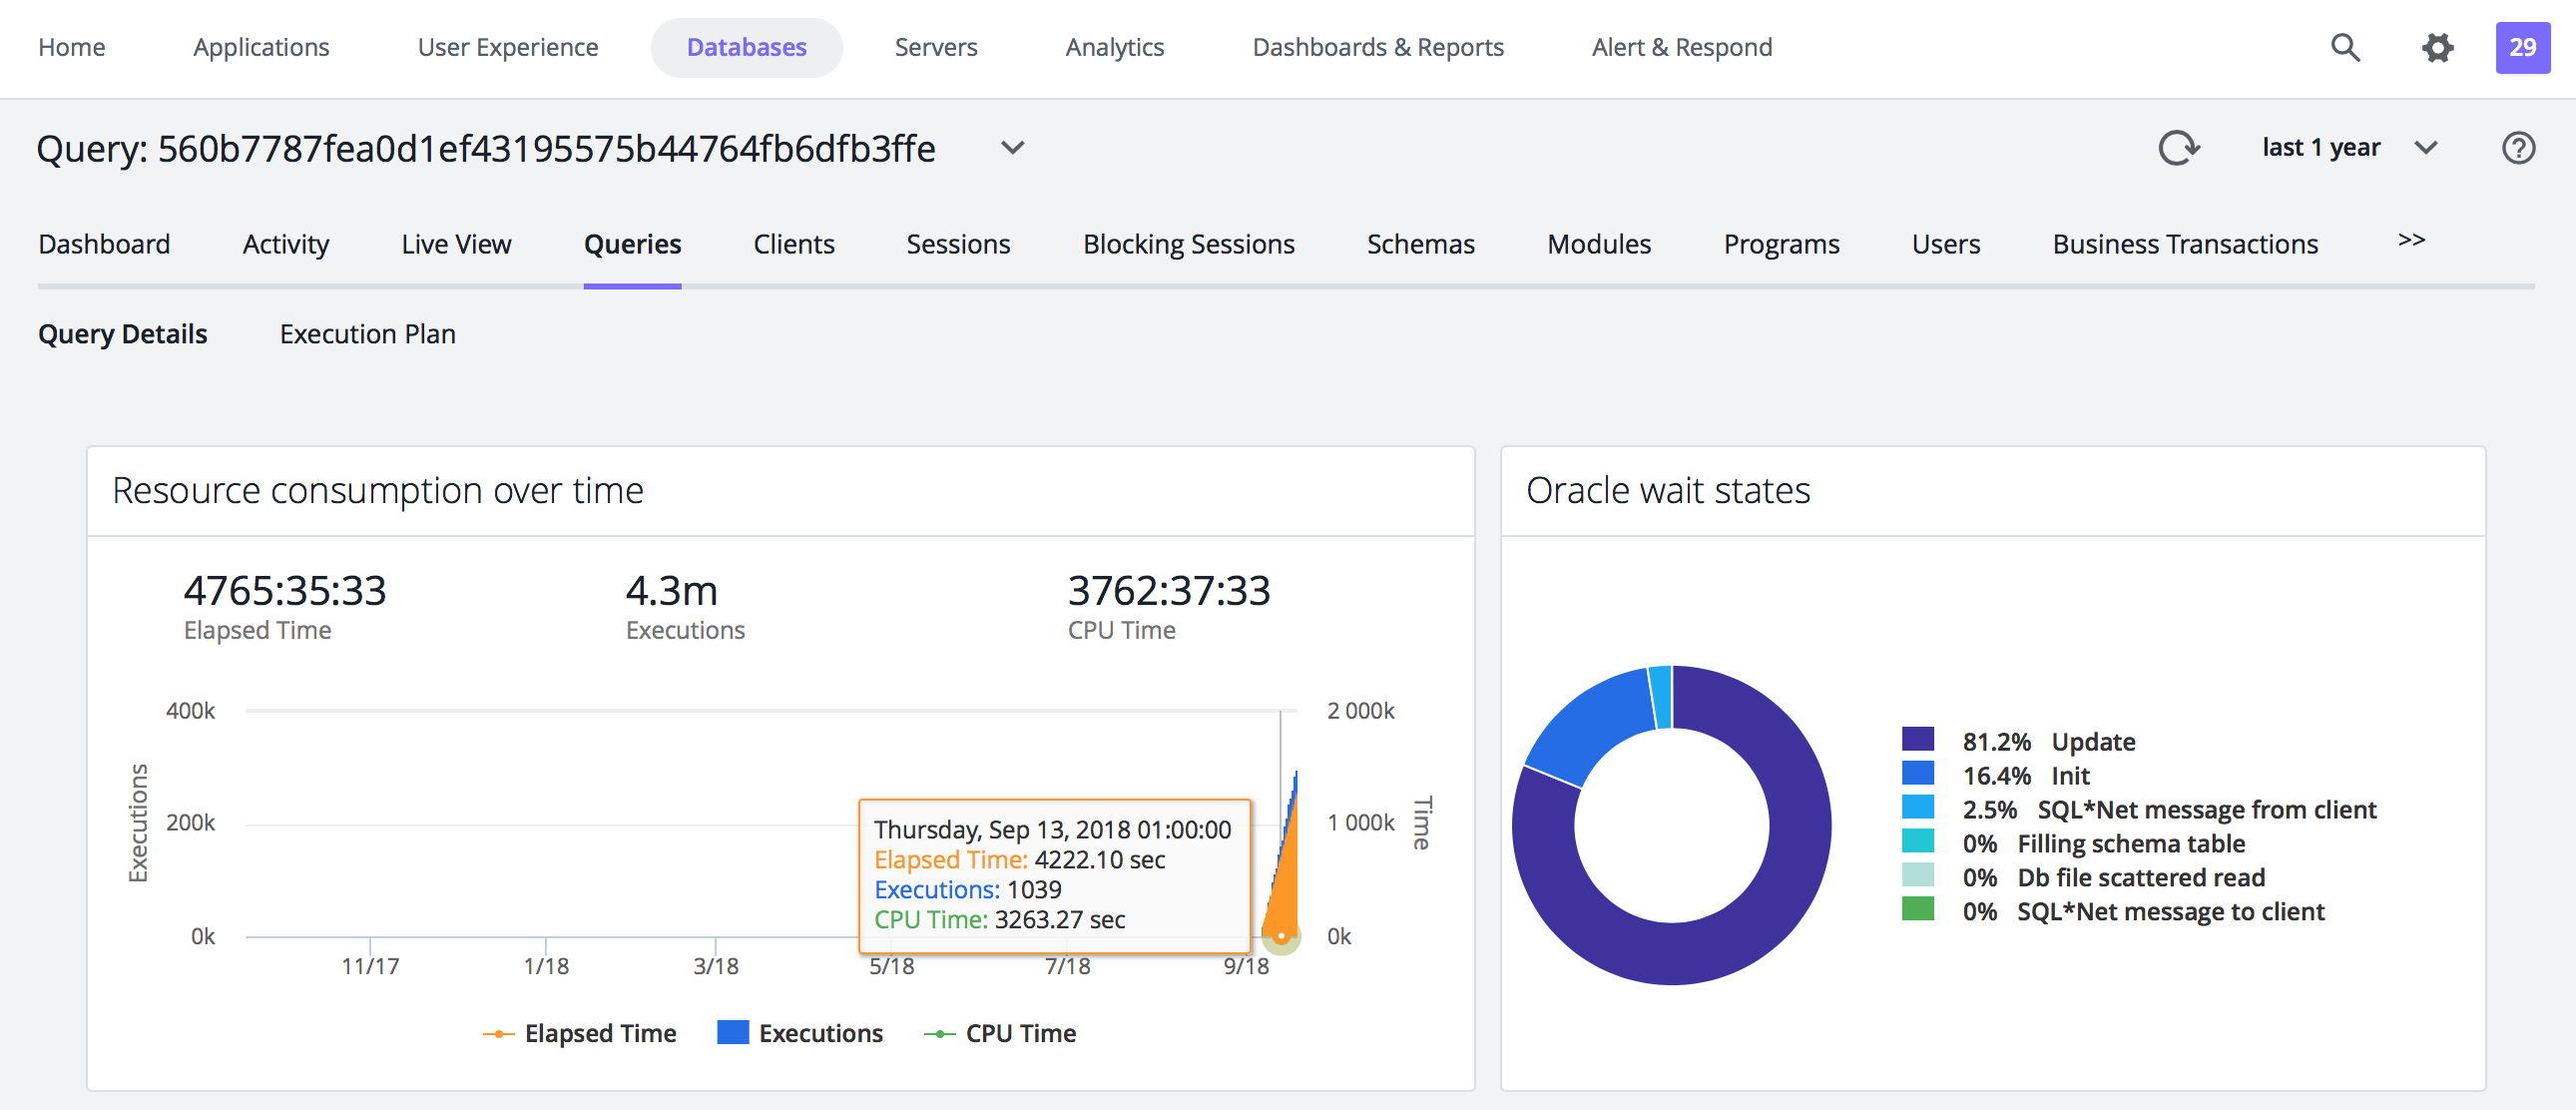
- Resource consumption over time: For SQL Server, Azure, Oracle, and DB2, shows the amount of time the query spent in the database using resources, the number of executions, and the amount of CPU time consumed. Query statistics are only available for the aforementioned database platforms.
The resource consumption card is also available for query groups. If all queries in the group have query metrics (e.g. elapsed time and number of executions), then the aggregate of the group's metrics are shown. If none of the queries in the group have query metrics, then the aggregate elapsed time of the queries in the group, taken from the wait state index, is shown. If some queries in the group have query metrics and others do not, then the aggregate value of the available query metrics is shown. - Business Transactions Executing Similar Queries: Displays the Java or PHP business transactions that execute queries similar to this query.
- Disk and buffer usage: Displays data when hardware monitoring is enabled for this database collector. This graph shows at a glance how effectively the database buffer is used. SQL that runs frequently is best kept in the buffer as physical disk reads are much more time-consuming. You may need to optimize your buffer manager if you see that the ratio of physical reads to buffer gets is too high.
- Clients: Shows the machines that executed the selected SQL statement and the percentage of the total time required to execute the statement performed by each machine. The table also shows the applications, nodes, and tiers of the machines.
- <database_type> wait states: Activities that contribute to the time it takes the database to service the selected SQL statement. The wait states consuming the most time may point to performance bottlenecks. For example, a db file sequential read wait state may be caused by segment header contention on indexes or by disk contention. See your database platform documentation for descriptions of the SQL wait states and recommended actions.
- Query Active in Database/Schema: Shows the schemas that have been accessed by this SQL.
- Query ID (Oracle) SQL Handle (SQL Server): A unique ID that allows the database server to more quickly locate this SQL statement in the cache.
- Query: The entire syntax of the selected SQL statement. You can click the pencil icon in the top right corner of the Query card to edit the query name so that it is easy to identify.
- Queries in Group (only in Group Details view): The top 100 queries in the query group
- Users: The users that executed this query.
- Programs/Applications: The program/application from which this query was executed.
To see how the SQL was executed internally within the database, click the Execution Plan tab. The statement execution plan is the sequence of operations the database performs to run the statement.
Oracle Explain Plan Limitations
For Oracle, AppDynamics Database Visibility displays execution plans for only SELECT, UPDATE, INSERT, and DELETE statements because Database Visibility relies on the Oracle EXPLAIN PLAN statement to obtain the execution plans and the Oracle EXPLAIN PLAN statement only provides the Oracle optimizer's execution plans for SELECT, UPDATE, INSERT, and DELETE statements. See also, User Permissions for Oracle.If you have a poorly performing piece of SQL that you are trying to tune, the obvious place to start is to look at the most costly step of the execution plan.
Tuning SQL is a vast topic, but a couple of things to look out for include:
- Index or table scans: May indicate a need for better or additional indexes.
- Bookmark Lookups: Consider changing the current clustered index, using a covering index and limiting the number of columns in the SELECT statement.
- Filter: Remove any functions in the WHERE clause, don't include views in your Transact-SQL code, may need additional indexes.
- Sort: Does the data really need to be sorted? Can an index be used to avoid sorting? Can sorting be done at the client more efficiently?