Download PDF
Download page Custom Memory Structures for Java.
Custom Memory Structures for Java
This page describes how to monitor custom memory structures for Java.
AppDynamics automatically tracks long-lived Java collections (HashMap, ArrayList, and so on) with Automatic Leak Detection. To track specific classes, you can use the Custom Memory Structures capability in the Controller UI.
You can use this capability to monitor a custom cache or other structure that is not a Java collection. For example, you may have a custom cache or a third party cache such as Ehcache. In a distributed environment, caching can easily become a prime source of memory leaks. In addition, custom memory structures may or may not contain collections of objects that would be tracked using automatic leak detection.
To configure custom memory structures, ensure custom memory structures are supported in your JVM environment. See JVM Support.
Monitoring custom memory structures with the Java Agent can result in increased CPU utilization. AppDynamics recommends you enable memory structure monitoring on a short-term basis only while troubleshooting or in pre-production environments.
Permissions
To enable or disable object instance tracking, you need the Configure Agent Properties permission.
To configure the custom classes to track, you need the Configure Memory Monitoring permission.
For information on AppDynamics Role Based Access Control, see Roles and Permissions.
Custom Memory Structures and Memory Leaks
Typically custom memory structures are used as caching solutions. In a distributed environment, caching can easily become a source of memory leaks. AppDynamics helps you to manage and track memory statistics for these memory structures.
AppDynamics provide visibility into:
- Cache access for slow, very slow, and stalled business transactions
- Usage statistics rolled up to the Business Transaction level
- Keys being accessed
- Deep size of internal cache structures
Automatic Leak Detection vs. Monitoring Custom Memory Structures
Automatic leak detection captures memory usage data for all map and collection libraries in a JVM session. However, custom memory structures may not contain all collections objects. For example, you may have a custom cache or a third-party cache such as Ehcache for which you want to collect memory usage statistics.
Using custom memory structures, you can monitor any custom object created by the app and the size data can be traced across JVM restarts. Automatic leak detection is typically used to identify leaks, while custom memory structures are used to monitor large coarse-grained custom cache objects.
The following provides the workflow for configuring, monitoring, and troubleshooting custom memory structures. You must configure custom memory structures manually.
- On the Tiers & Nodes dashboard, use the Automatic Leak Detection, On Demand Capture Session feature to determine which classes aren't being monitored, for example, custom or third-party caches such as EhCache.
- Configure Custom Memory Structures and then restart the JVM if necessary.
- Enter the fully-qualified classname on the Create New Instance Tracker window and click Save.
AppDynamics automatically tracks long-lived Java collections (HashMap, ArrayList, and so on) with Automatic Leak Detection.
- Turn on Custom Memory Structures monitoring to detect potential memory leaks in the custom memory structures you have configured.
- Drill down into leaking memory structures for details that will help you determine where the leak is.
To identify custom memory structures:
- On the Automatic Leak Detection subtab of the Memory tab, click On.
- Click Start On Demand Capture Session to capture information on which classes are accessing which collections objects. Use this information to identify custom memory structures.
AppDynamics captures the top 1000 classes, by instance count.
Identify Potential Memory Leaks
Start monitoring memory usage patterns for custom memory structures. An object is automatically marked as a potentially leaking object when it shows a positive and steep growth slope. The Memory Leak dashboard provides the following information:

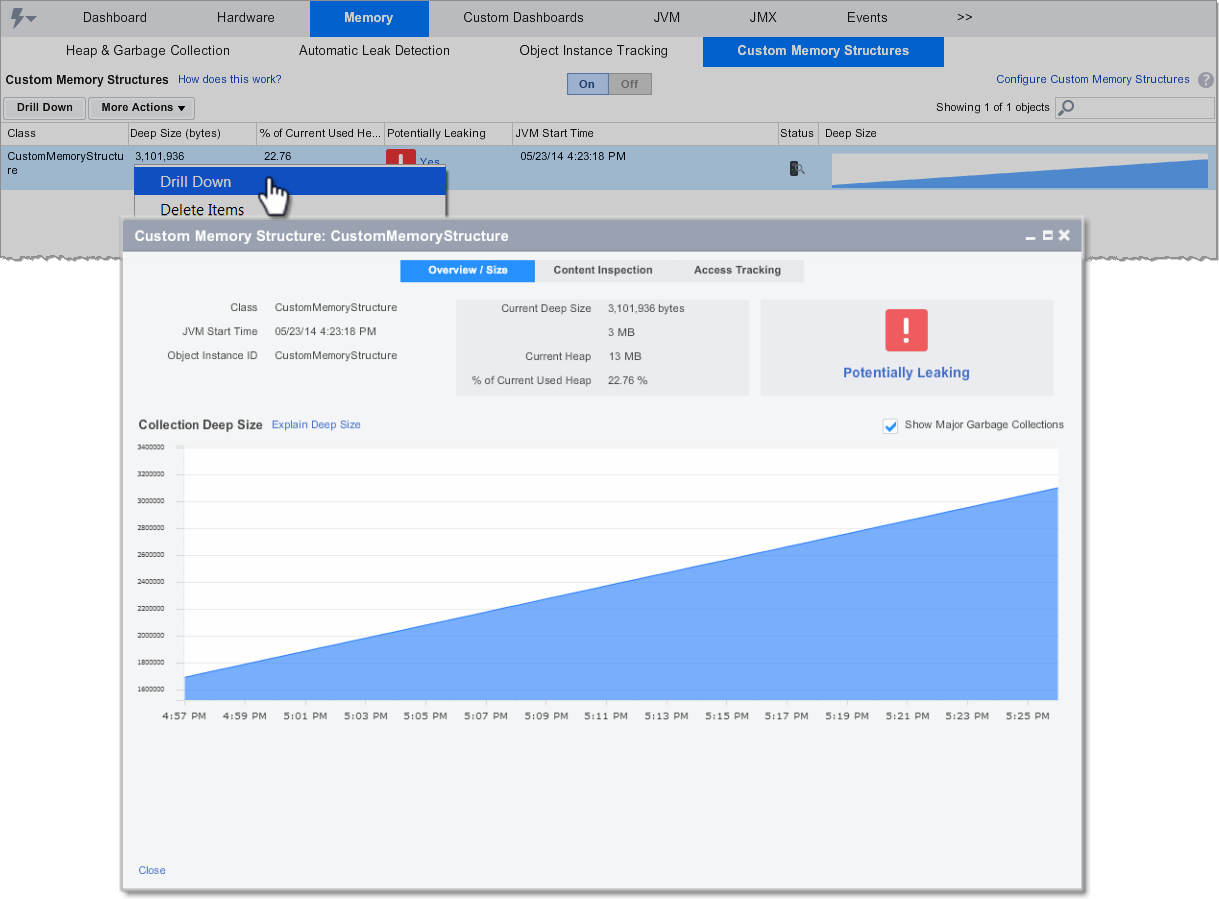
The Custom Memory Structures dashboard provides the following information:
- Class: The name of the class or collection being monitored.
- Deep Size (bytes): The upper boundary of memory available to the structure. The deep size is traced across JVM restarts
- % of Current Used Heap: The percentage of memory available for dynamic allocation.
- Potentially Leaking: Potentially leaking collections are marked as red. We recommend that you start a diagnostic session on potentially leaking objects.
- JVM Start Time: Custom Memory Structures are tracked across JVM restarts.
- Status: Indicates if a diagnostic session has been started on an object.
- Deep Size: A positive and steep growth slope indicates a potential memory leak.
After the potentially leaking collections are identified, start the diagnostic session.
Diagnose Memory Leaks
On the Custom Memory Structures dashboard, select the class name to monitor and click Drill Down.

Isolate Leaking Collections
Use Content Inspection to identify to which part of the application the collection belongs. It allows monitoring histograms of all the elements in a particular memory structure. Start a diagnostic session on the object and then follow these steps:
- Select the Content Inspection tab.
- Click Start Content Summary Capture Session.
- Enter the session duration. Allow at least 1-2 minutes for the data to generate.
- Click Refresh to retrieve the session data.
- Click a snapshot to view the details about that specific content summary capture session.

Access Tracking
Use Access Tracking to view the actual code paths and business transactions accessing the memory structure. Start a diagnostic session on the object and follow these steps:
- Select the Access Tracking tab.
- Select Start Access Tracking Session.
- Enter the session duration. Allow at least 1-2 minutes for data generation.
- Click Refresh to retrieve the session data.
- Click a snapshot to view the details about that specific content summary capture session.
