Mobile RUM provides substantial information on crashes and network and server-related performance. You may want, however, to customize the Mobile Agent to collect other metrics and data to understand how your application is performing for your users.
For information on customizing the agent, including sample code, see the following:
To see the results of your data collection, you use the Custom Data view.
Custom Data Types
There are three kinds of custom data that you can collect:
There are two other types of custom data: the breadcrumb and user data. Breadcrumbs are displayed only in Crash Snapshots. User data is available in Crash Analyze and Network Request Analyze. See the agent SDK docs for more information.
Info Points
An information point allows you to collect information on how a specific method in your code is performing. How many times was a particular method executed? Was an exception thrown? If you need to monitor multiple methods, you can create multiple info points.
If you know there are important methods you always want to monitor, create static info points as described in Customize the iOS Instrumentation and Customize the Android Instrumentation.
Custom Timers
Custom timers allow you to time how long something takes between any arbitrary start point and end point, even if they span multiple methods. For example, how long did it take to repaint a frame buffer? How long did the app take to start up?
Custom Metrics
Custom metrics allow you to collect data on any metric you define in your application. Metrics can be any integer-based data. Over the specified time frame, Mobile RUM calculates the minimum, maximum, average, sum, and count of these values.
View Custom Data
Your data is shown in tabular format in two tabs.
Custom Timers & Metrics
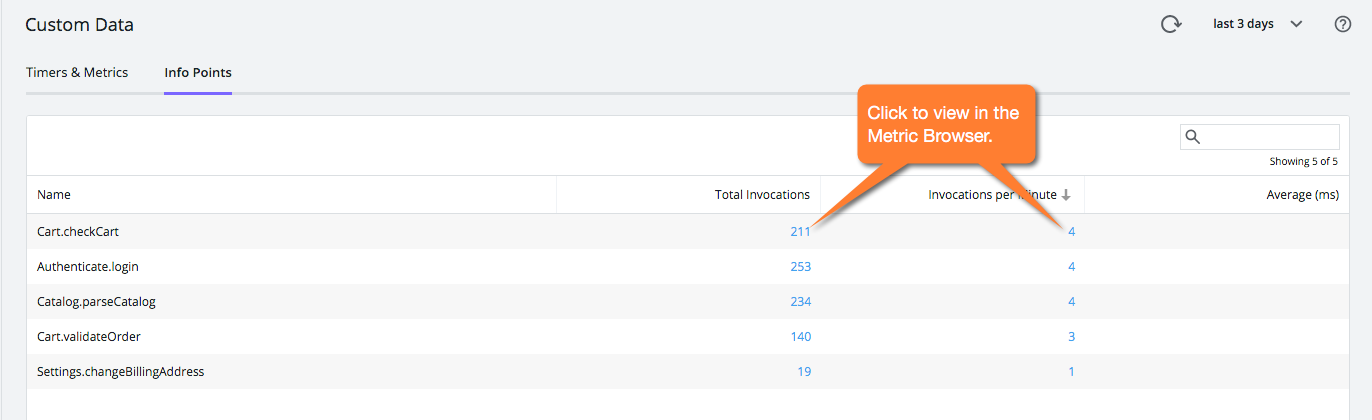
Click on any value (in blue) to display the same metric in the Metric Browser.

Info Points
The Info Points tab shows any current info points.