Follow these steps to troubleshoot a resource from Sessions:
Go to Sessions.
Add criteria and set the Page Experience to Very Slow.
Double-click on a session record.
In the Session Summary select the page with the longest End User Response Time.
In the Waterfall tab, click a problematic resource to open the Resource Details dialog.
Click Analyze Resource.
You are redirected to Resource Performance > Resources. The resource becomes the filter for the dashboard data.
In the widgets, look for patterns or possible factors such as geographic location, domains, and so on. See Diagnose Problematic Resources to learn some strategies for diagnosing resource issues.
To rule out environmental factors such as network connections, browser, and so on, create a synthetic job that calls a page with the resource to confirm the resource is the problem.
Discover Top Resource Violations
Follow these steps to determine which resource is causing the most performance violations:
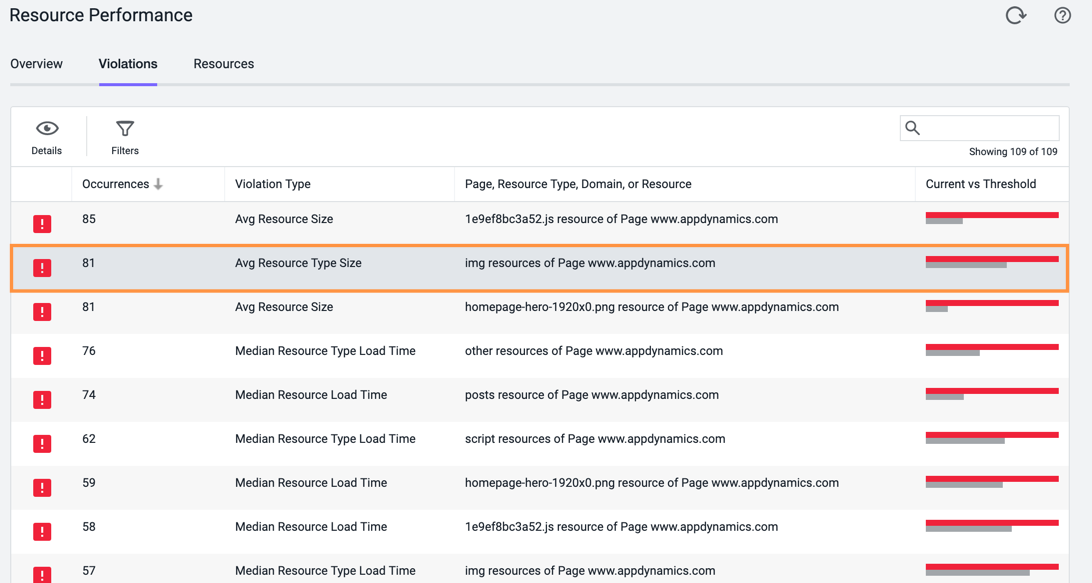
Go to the Resource Performance > Violations.
Select the Occurrences column so that number of occurrences is in descending order.
Double-click the top-occurring violation.
You are redirected to the Resources tab with information for the resource in violation.
Analyze Resources by Region
Follow these steps to analyze and monitor a resource based on a region:
Go to the Resources tab.
From the Add Criteria drop-down, select Load Time and specify the value to be greater than 10000 (10 seconds).
Click Apply.
Click .
In the Create dialog, enter "Resources Loading Slower Than 10 Seconds," and click OK.
Scroll down to the Resource Load Time by Region widget.
Diagnose Problematic Resources
Follow these steps to diagnose why certain image resources are taking a long time to load:
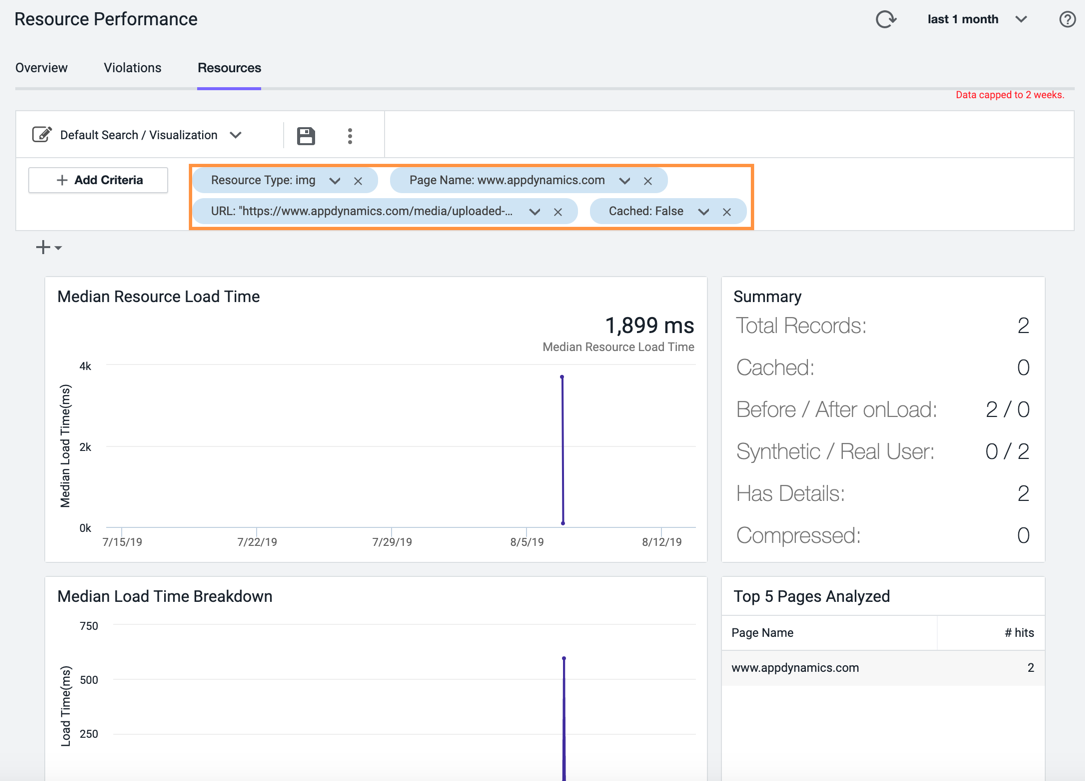
From the Violations tab, double-click on a resource. You are redirected to the Resources tab with the resource applied as a data filter.
Select criteria fields to determine possible causes, such as Region, Cached, Compressed, Load Time, Domain, and so on.
Example: Confirm that resources are cached or compressed.
Example: Add criteria that may indicate issues with the server based on the location of the resource, such as DNS Lookup Time, Connection Time, Wait Time, and Request Time.
Search for patterns that indicate the cause within the widgets, providing insights such as:
Resource load time speed in certain regions
Top pages using the resource
Median load time breakdown showing that load time slows down at certain intervals
Resource size increases
To rule out environmental factors such as network connections, browser, and so on, create a synthetic job that calls a page with the resource to confirm the resource is the problem.