AppDynamics for Databases
2.9.x Documentation
On this page:
This page illustrates the pre-defined reports available from the Reports menu on the Activity tab. The type of reports available depend on the database platform being monitored.
Reports use the time context (start/end time) from the Main window and therefore may be pre-populated with data. You can change the time range for a specific report and click Run Report.

Supported Databases | Description | Notes |
|---|---|---|
All Databases | This report shows a summary of Elapsed Time, Executions and % CPU of the | Time metrics only are available for the Microsoft SQL Azure Database. |

Supported Databases | Description | Notes |
|---|---|---|
All Databases | This report shows a chart for a specific statistic collected for the database over a | Only four of the Statistics are available for the Microsoft SQL Azure Database. |
The following shows the parameters you can configure for the report and an example of a "bytes received via SQL*Net from client" statistics report:

Supported Databases | Description |
|---|---|
All Databases | This report displays time-series data on Wait Events (states) within the database. |

You can change the descriptions that appear for the database wait states. For more information, see Change Wait State Descriptions.
Supported Databases | Description | Notes |
|---|---|---|
All Databases | This report can be used to show a high level summary of Elapsed Time, Executions | The Elapsed Time metric only is available for the Microsoft SQL Azure Database. |

Supported Databases | Description | Notes |
|---|---|---|
Microsoft SQL Server | This report shows server performance metrics related to the database running on that server. | This report is not available for the Microsoft SQL Azure Database. |

Supported Databases | Description | Notes |
|---|---|---|
Microsoft SQL Server | This report shows size, workload and I/O metrics for the database storage system. | This report is not available for the Microsoft SQL Azure Database. |

Supported Databases | Description |
|---|---|
Oracle | Similar to the Top SQL Report for Oracle, but rather than reporting on each SQL |

Supported Databases | Description |
|---|---|
All Databases | This report displays data in a table and highlights the time spent in each wait state for each SQL statement. |

Supported Databases | Description |
|---|---|
DB2, Microsoft SQL Server, MySQL, Sybase, PostgreSQL | This report compares two points in time. The report displays 3 time-series graphs with side-by-side comparisons of time period 1 (T1) and time period 2 (T2). The first graph displays Top SQL (in the same format as the Top SQL report). The second graph displays %CPU consumption of the database instance host. The third graph displays database waits (in the same format as the Database Wait Report). Tabular data at the bottom of the report displays comparisons of elapsed time differences between T1 and T2 on a per-SQL statement basis. |
Microsoft SQL Server 2005 and above | This report compares two time periods using DMV collected data. |
| Microsoft SQL Azure Database | This report compares two time periods using DMV collected data. |
Oracle | This report compares two time periods. It is possible to compare based on the Top N Queries chosen based on Elapsed Time, CPU, Executions, Buffer Gets, Rows Processed, Disk Reads etc. |

Supported Databases | Description |
|---|---|
Oracle | Similar to the Top SQL Report for Oracle, it allows filtering by SQL Command Type such as Select, Insert, Alter, etc. |

Supported Databases | Description |
|---|---|
DB2, Microsoft SQL Server, Microsoft SQL Azure Database, MySQL, Sybase, PostgreSQL | Uses the activity data collected by the collector to display the Top N SQL statements in a time-series view. Each SQL statement is color-coded, with “Other SQL” displayed at the top of the graph in pink. The Y-Axis displays elapsed time in seconds. |
Microsoft SQL Server 2005 and above, and Microsoft SQL Azure Database | Uses data collected by Dynamic Management View (DMV) queries to display Top N SQL Statements in a time-series view. The Y-Axis can be switched between CPU, Elapsed Time, Execution Count, Logical Reads, Logical Writes, Physical Reads and CLR Time. |
Oracle | Uses data collected by v$ queries to display the Top N SQL statements in a time-series view. The Y-Axis can be switched between CPU, Elapsed Time, Executions, Buffer Gets, Rows Processed, Disk Reads and Parse Calls. |

“Other SQL” is a bucket of all other distinct SQL queries outside of the Top N. For example, if your report shows the top 10 SQL, then “Other SQL” represents all other distinct queries from the 11th upwards.
The Top 10 often represents 80%+ of the activity, but in your case it looks like it’s only about 20% i.e. they have lots of unique SQL queries sharing the resource consumption. You could reduce the amount of “Other SQL” by increasing N, for example display the top 20 SQL queries.
Supported Databases | Description |
|---|---|
Microsoft SQL Server | This report gives information on physical I/O performed by the database instance. |
Oracle | This report gives information on physical I/O performed by the database instance. |

Supported Databases | Description |
|---|---|
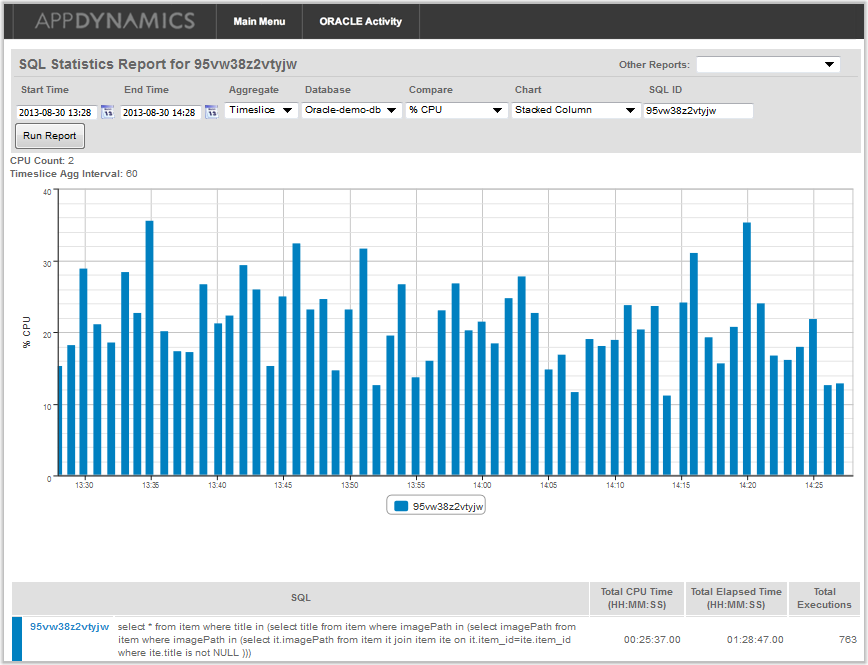
Oracle | This report gives you direct access to the SQL Statistics Report for a specific SQL statement identified by its SQL ID. You can also access this report by double-clicking an SQL statement on the Database Platform window to access the SQL tab, and then clicking SQL ID Report |

The following shows the SQL Statistics Report.
The following demonstrates another way to initiate the SQL ID Report from the Oracle SQL tab.

Supported Databases | Description |
|---|---|
PostgreSQL | This report gives a summary of performance and activity within a PostgreSQL instance for a specific time period and for a specific database. It provides instance instance statistics for Time in Progres, Query Throughput, and CPU. It also provides information for the CPU hosting the Postre instance, including CPU Architecture, CPU Count, and CPU Speed. |

Supported Storage Systems | Description |
|---|---|
NetApp | This report provides a comprehensive view of storage capacity, allocation, and usage. |

Supported Storage System | Description |
|---|---|
NetApp | This report provides a comparison of NetApp performance metrics collected during two specified time periods. |
