The Connection Explorer (Explorer link, right side of Network Dashboard) shows all application flows and TCP Connections for an application in one table. Use the Connection Explorer for large, complex applications. You can sort the table based on network KPIs to locate flows with performance issues; then you can drill down and analyze the supporting connections in right-click Connection Dashboards. See Flows, Links, and Connections.

The Connection Explorer shows information for:

The Explorer shows this information for each network link. Select View Options to show or hide information as appropriate.

  • Source
  • Destination
  • Network Element

    Tip

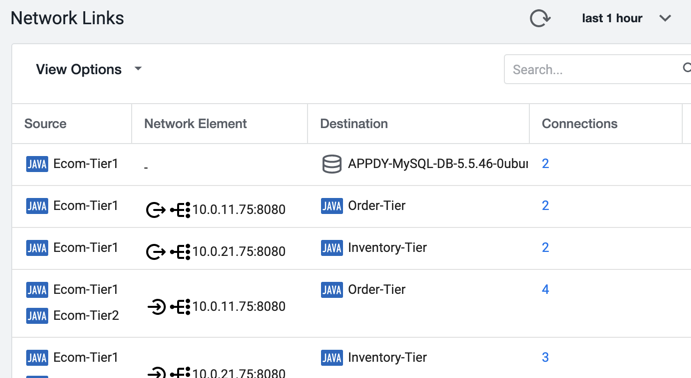
    If two flows connect through a Load Balancer (LB), the table shows the LB IP:port and the connection source:

    Flow direction: LB --> Tier 
    Flow direction: Tier --> LB 

    To see the relationships between application tiers and intermediate Load Balancers (LBs) more clearly, you can drag the Network Element heading so that the columns are ordered Source | Network Element | Destination.

    Network Links

  • Connections
  • Latency
  • Errors
  • PIE
  • TCP Loss (Mille)

Connections

To view the load balancer details for a connection, click the connection. Select View Options to show or hide information as appropriate.

  • Source IP, or Fully Qualified Domain Name (when available) for Load Balancers and TCP Endpoints
  • Destination IP, or Fully Qualified Domain Name (when available) for Load Balancers and TCP Endpoints