You can integrate Database Visibility with Server Visibility to capture accurate hardware metric details from the Machine Agent (with Server Visibility) to the Database Visibility dashboard. These metrics display without the need for an SSH connection to the host machine. Additionally, this integration helps the Server Visibility machine to automatically connect to the Database Visibility server when both the Database Agent and the Server Visibility Agent capture the same IP address.
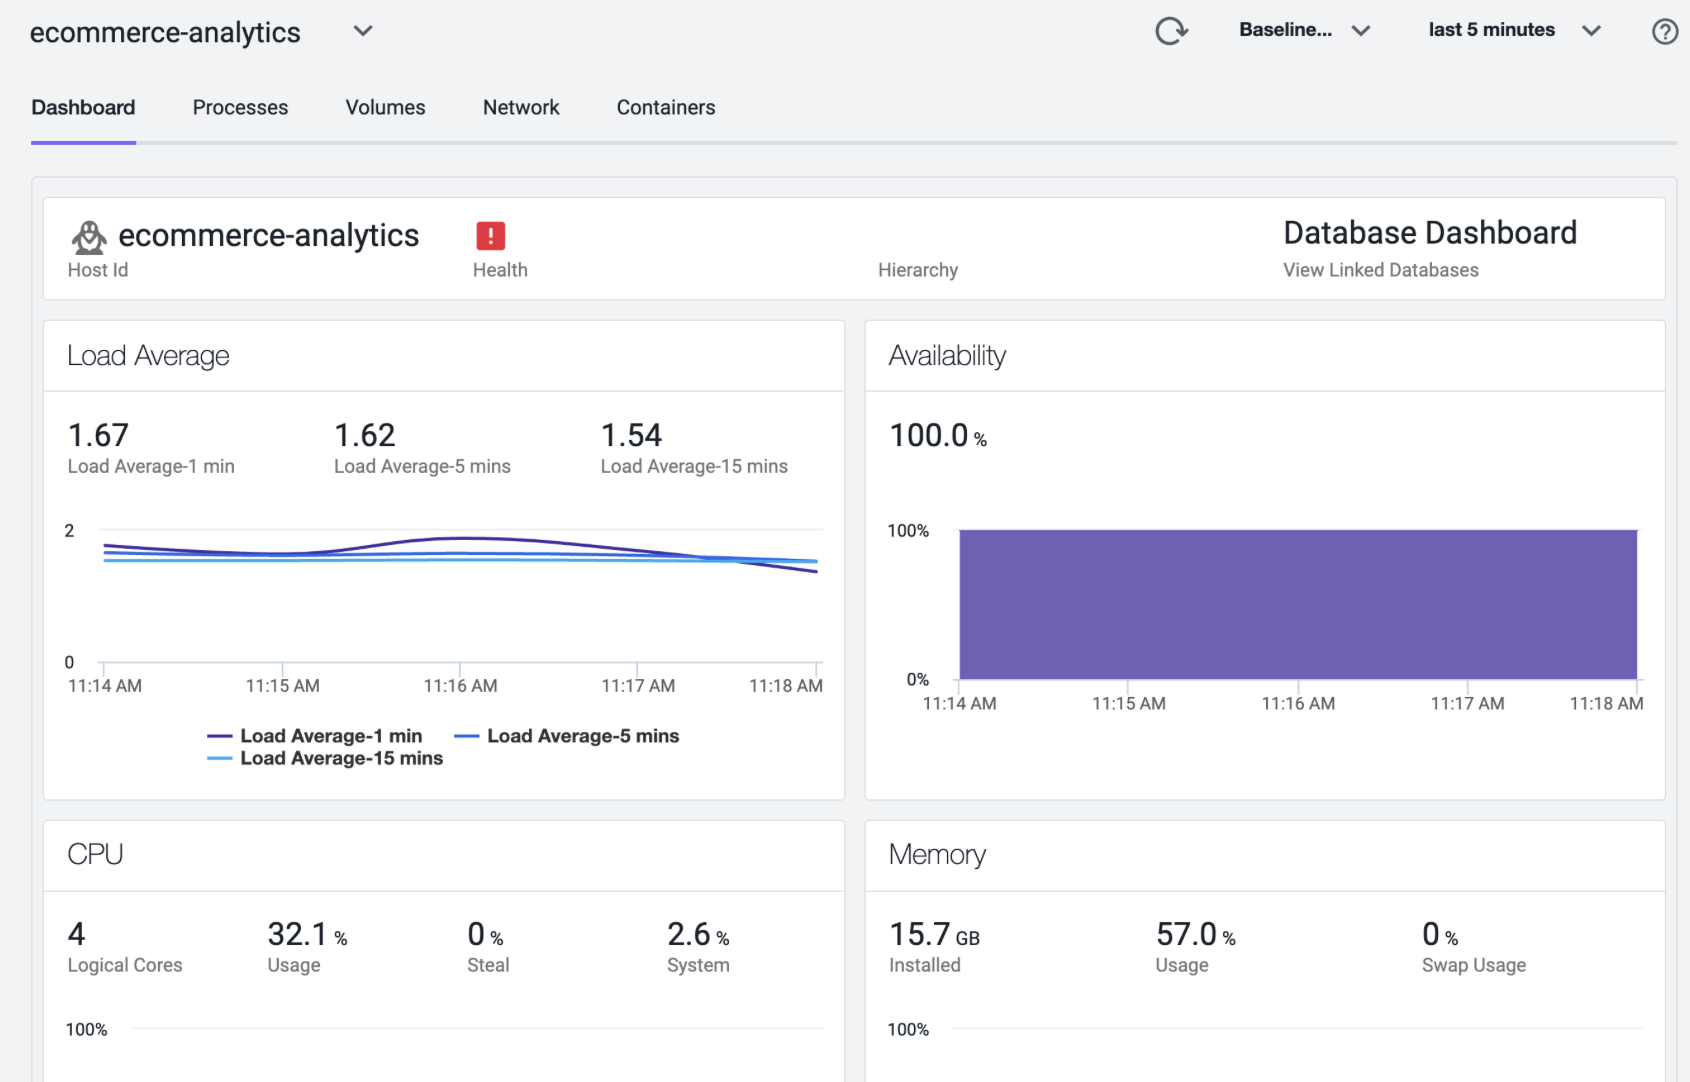
When you integrate Server Visibility with Database Visibility, you can view these metrics on the Database Dashboard:
- CPU Busy% instead of CPU System% and CPU User%
- Memory Used%
- Disk IO (in Ops/sec for Reads and Writes) instead of Disk IO in KB/sec
- Network IO (in KB/sec for Outgoing and Incoming)
Requirements
To view the hardware metrics from Server Visibility to the Database Visibility dashboard, you must ensure to meet the following requirements:
View Hardware Metrics
You can view the Server Dashboard section on the Databases dashboard when the Machine Agent and the Database Agents are registered and connected.
You can manually connect or disconnect the Database Visibility Server with the Server Visibility Server by using the URL, Link this database to a server, described in the Server Dashboard section. You may require to manually connect the database node to the Server Visibility server in these scenarios:
- The IP addresses do not match and the servers are not connected automatically.
- You want to connect the database server to another Server Visibility machine.
- You do not require connecting a particular database server to a Server Visibility machine.

You can map multiple database nodes to a single Server Visibility machine.
If the servers are connected, then you can find the link to the connected Server Dashboard under the Server Dashboard section.
For a database cluster, you can find the link to each Server Dashboard corresponding to each database node. When you click the connected server under the Server Dashboard section, the page redirects to the Server Visibility dashboard with all the hardware metrics.
On the Server Dashboard, you can click the Database Dashboard, which displays a dialog that includes the list of database nodes that are connected to the Server Visibility machine. You can select any database node to navigate to the Database Dashboard.