The business transaction is an end-to-end, cross-tier processing path that is used to complete a request for a service provided by the application.
Perform the following after selecting the required application from the Splunk AppDynamics SaaS Controller UI:
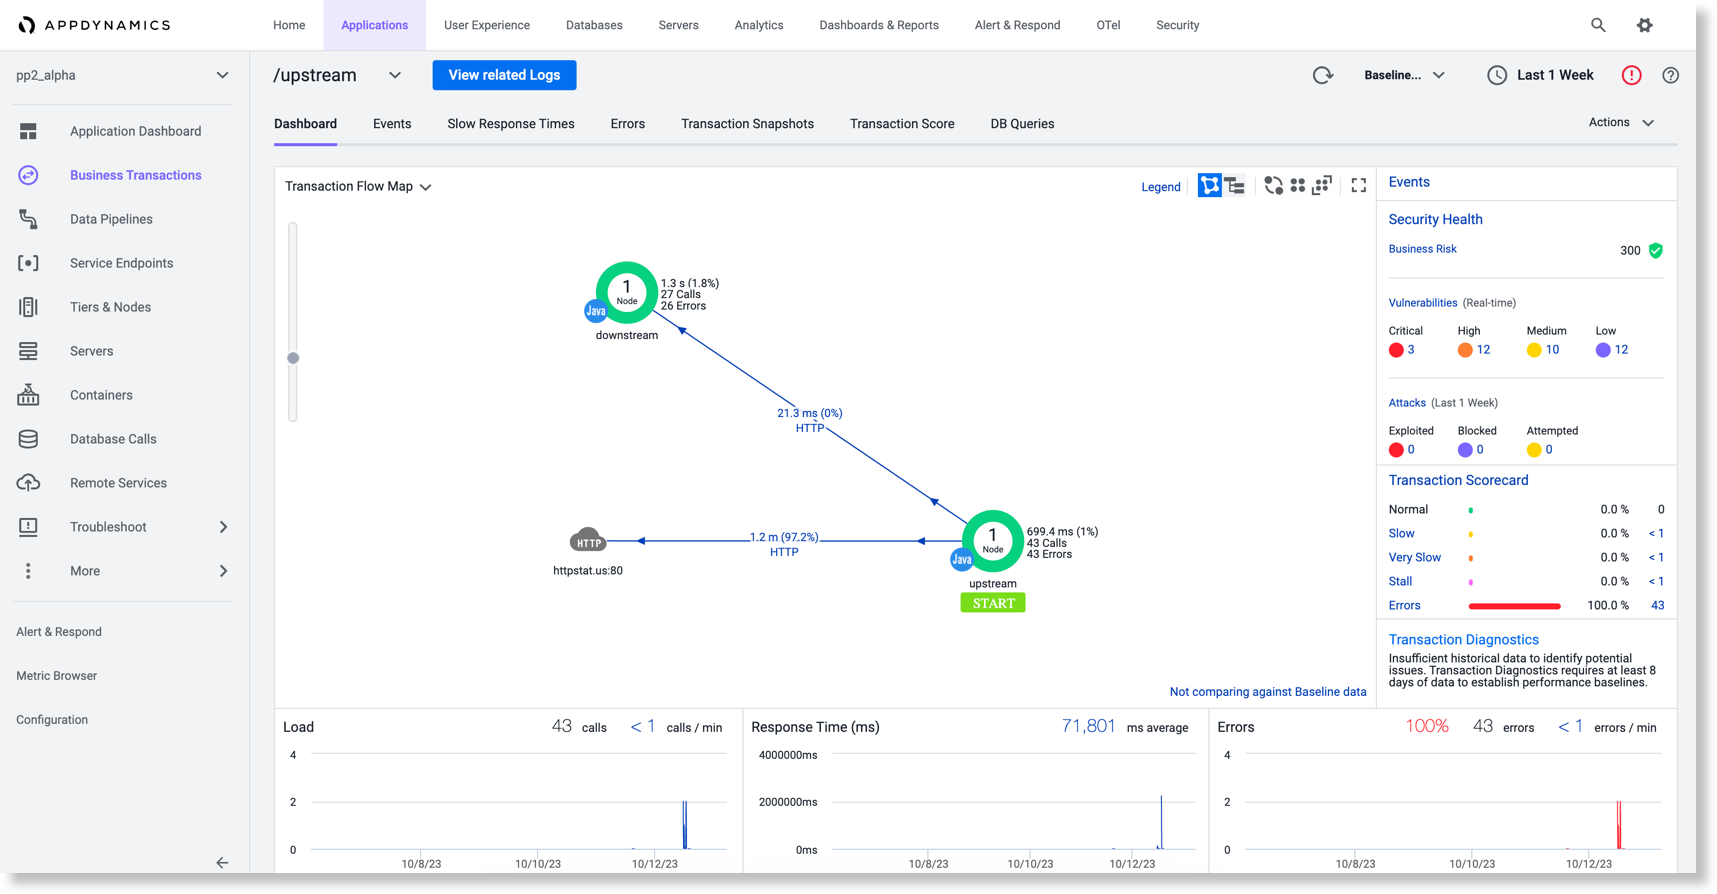
Click Business Transactions on the left pane.
Select required business transaction, then click Details. Select the time range for which you require the log details.
Click View related Logs. If the View related Logs button is not displayed, then there are no logs during the selected time range, you can change the time range to view the button.
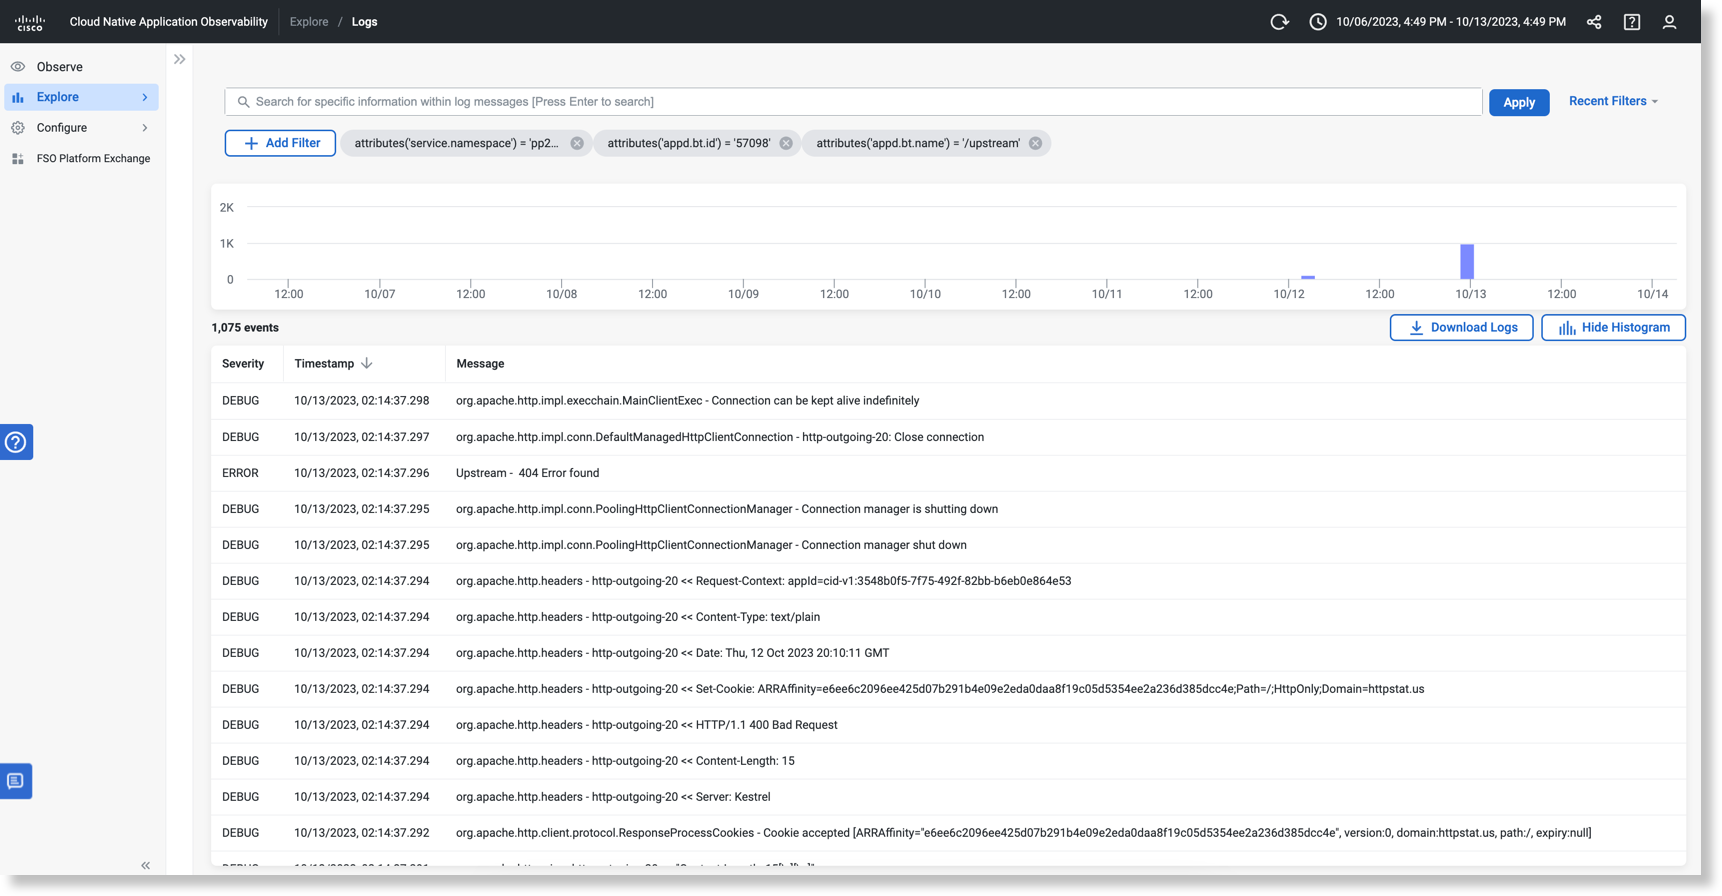
This opens a new tab with the Cisco Cloud Observability UI where you can view the logs of a specific application business transaction. The selected Business Transaction is added as filter on the Cisco Cloud Observability UI. You can view the Business Transaction filter as the business transaction ID (appd.bt.id) in the UI. This is the filter that you can view on the UI:
attributes(“service.namespace”)='<app name in saas>';attributes(“appd.bt.id”)='<business transaction ID>';attributes(“appd.bt.name”)='<Business Transaction name as in CSaaS>'