Download PDF
Download page View OpenTelemetry™ Data in the Controller UI.
View OpenTelemetry™ Data in the Controller UI
Splunk AppDynamics for OpenTelemetry™ ingests and aggregates traces into Business Transaction flow metrics in the Controller UI. A trace represents an end-to-end request which can be made up of one or multiple spans. Each span represents one event within a component in the application triggered in the trace. The Business Transaction represents the entire graph of all traces sharing the same root span and visualizes how traces flow between services.
Before You Begin
To view OpenTelemetry data in the Controller UI, you need the following:
SaaS Controller >= 22.3.0
Paid or trial Splunk AppDynamics license
For information on data limits for Splunk AppDynamics for OpenTelemetry, see License Entitlements and Restrictions.
View OpenTelemetry Data in the Controller UI
Application Dashboard
The Application Flow Map is a dynamic visual representation of your monitored environment's components and activities. Monitored services using OpenTelemetry are represented by the OpenTelemetry telescope icon. For a list of supported language in the flow map, see Supported Languages.
To view OpenTelemetry data on your Application Dashboard:
- Go to your OpenTelemetry-enabled application.
- Click Application Dashboard > Dashboard.
After instrumentation, it may take up to five minutes for data to populate in the Controller UI.
Known Issue
For OpenTelemetry flow maps, Business Transactions (BTs) can lose the upstream context and appear as new BTs rather than continuations. This causes BTs to appear split up in the BT dashboard, resulting in BT Metrics to be split up as well.
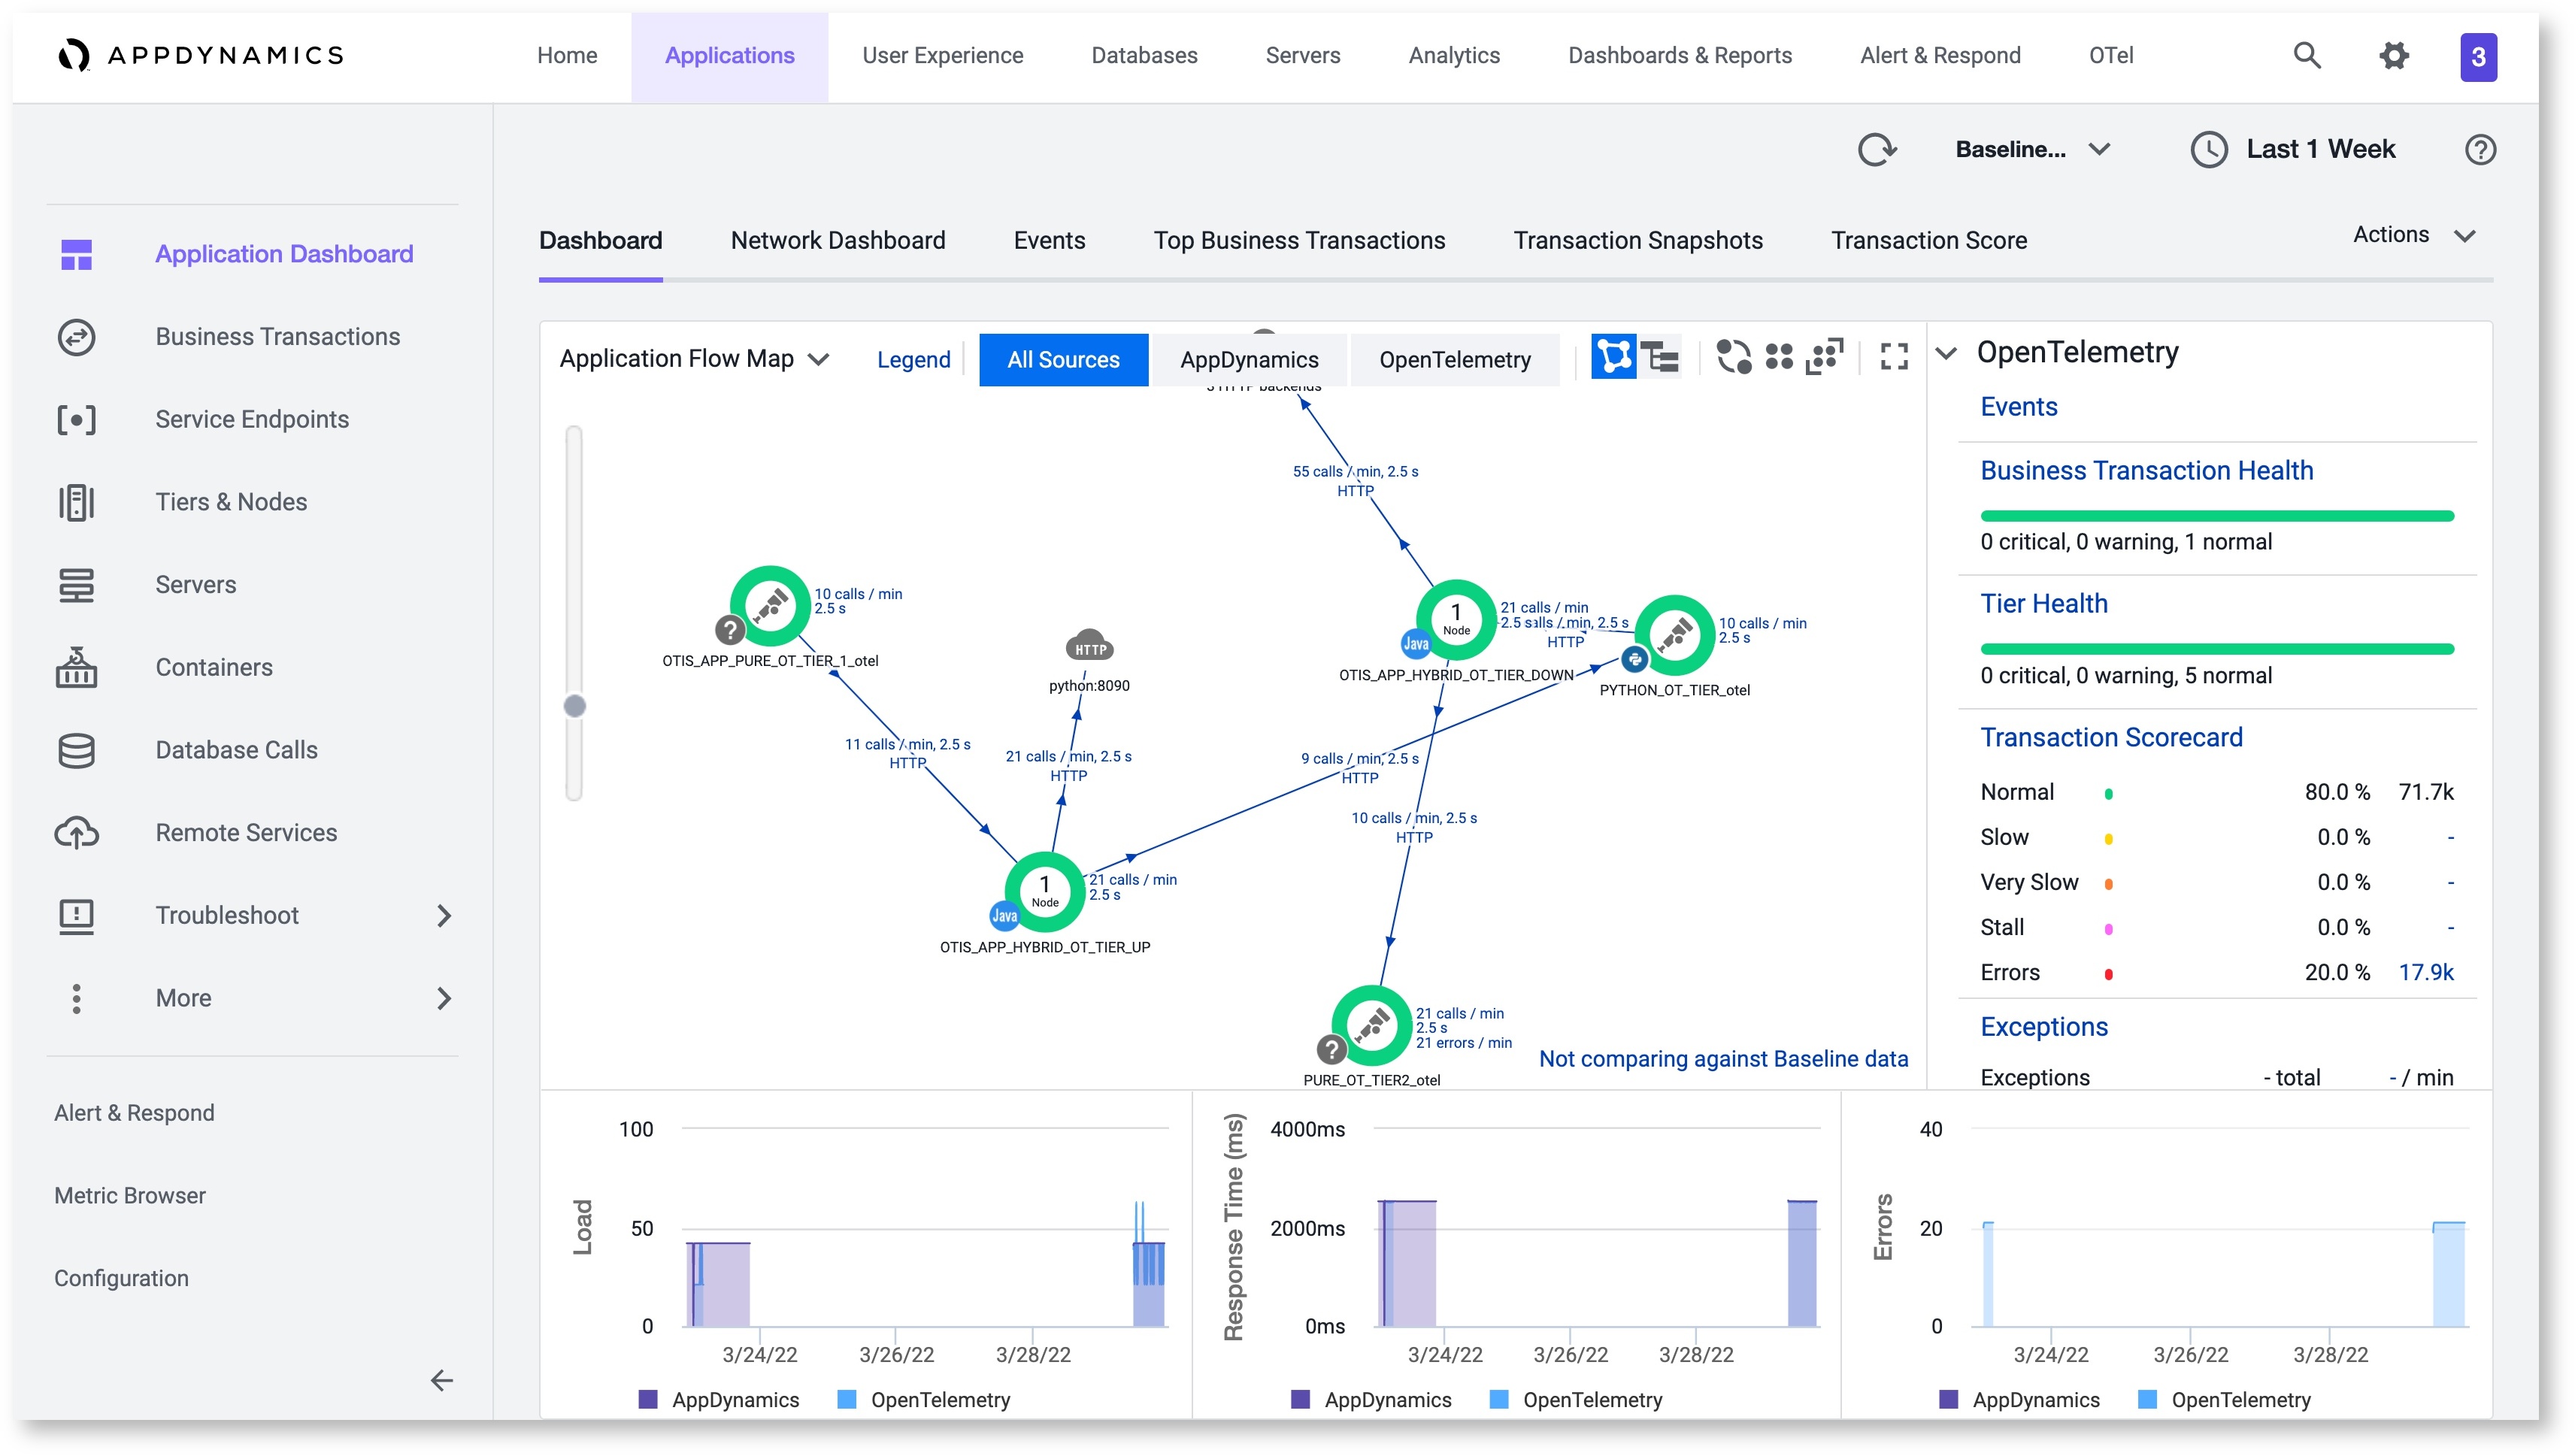
The All Sources view shows a blend OpenTelemetry and Splunk AppDynamics source data.
In the OpenTelemetry source view, the Flow Map displays data and activity between tiers. Only tiers are displayed in the OpenTelemetry source view; no node-level details are available.
If you want to look at data from just one tier, click on a tier in the Flow Map. You'll be redirected to the Tiers & Nodes Flow Map which will populate with data for that OpenTelemetry tier.
See Learn how to navigate and customize flow maps.
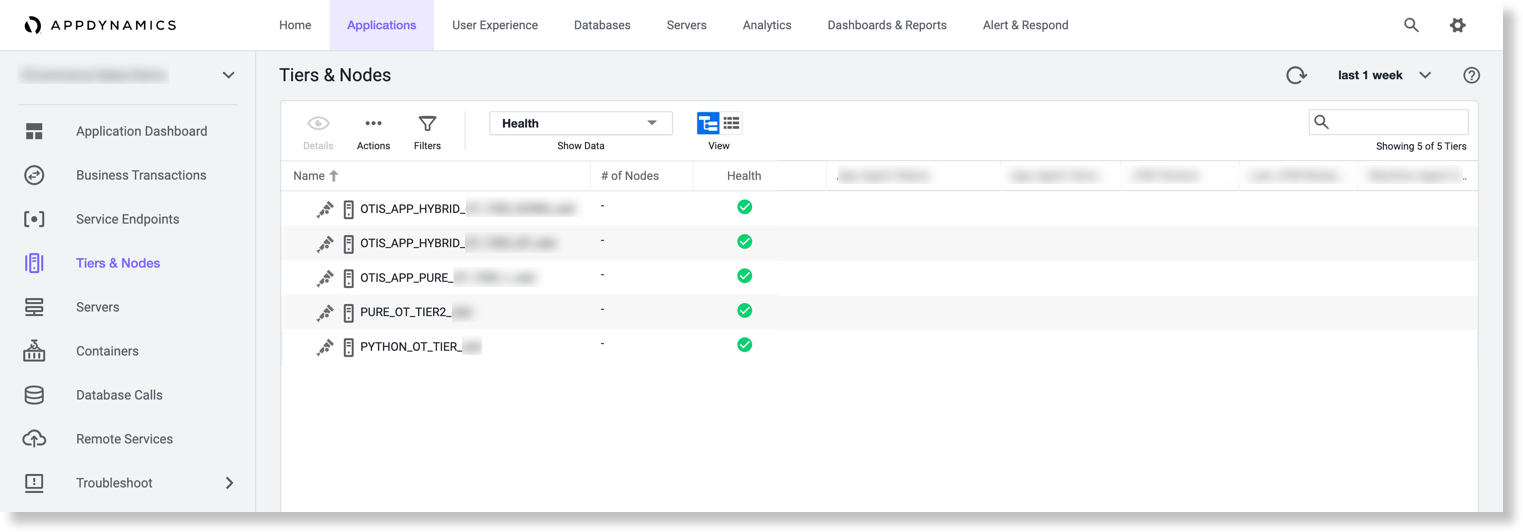
Tiers & Nodes
On Tiers & Nodes, you can view a list of all tiers in an application. The tiers represent the services (defined by service.name) that were encountered by the ingested traces. To investigate specific tiers, double-click on a tier name and see a new flow map that is updated with tier-specific data.
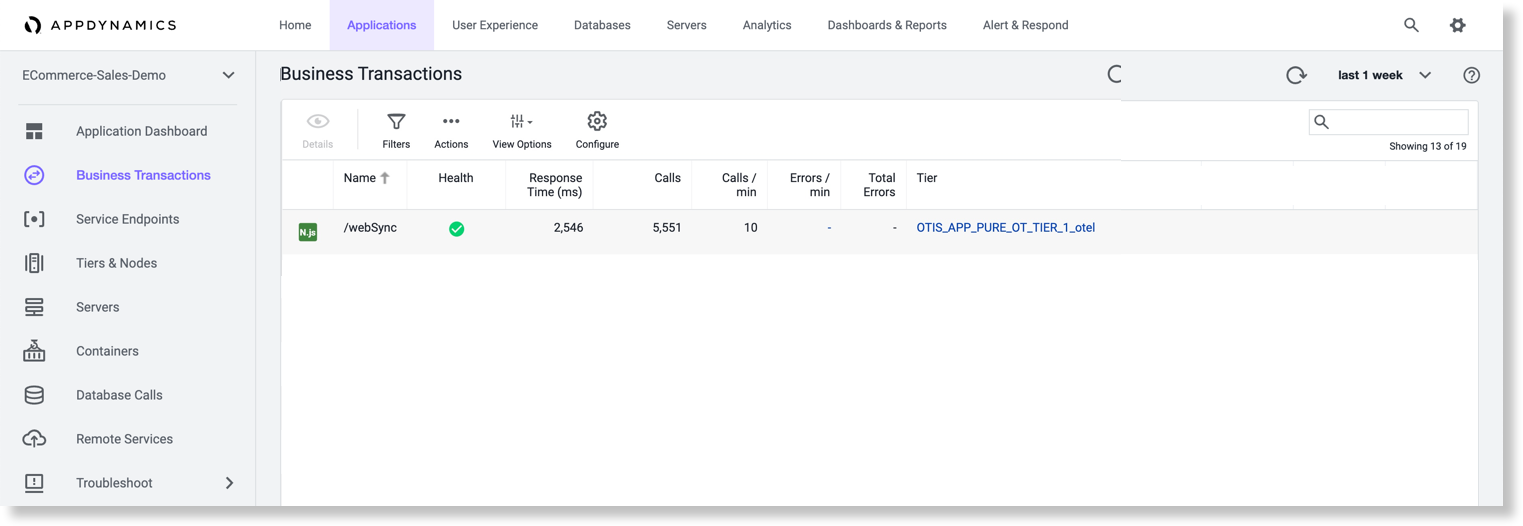
Business Transactions
On Business Transactions, the names of the Business Transactions are derived from the name of the first span of each trace (also known as the root span). The health status, response time, number of calls, and other metrics are reported for the Business Transaction.
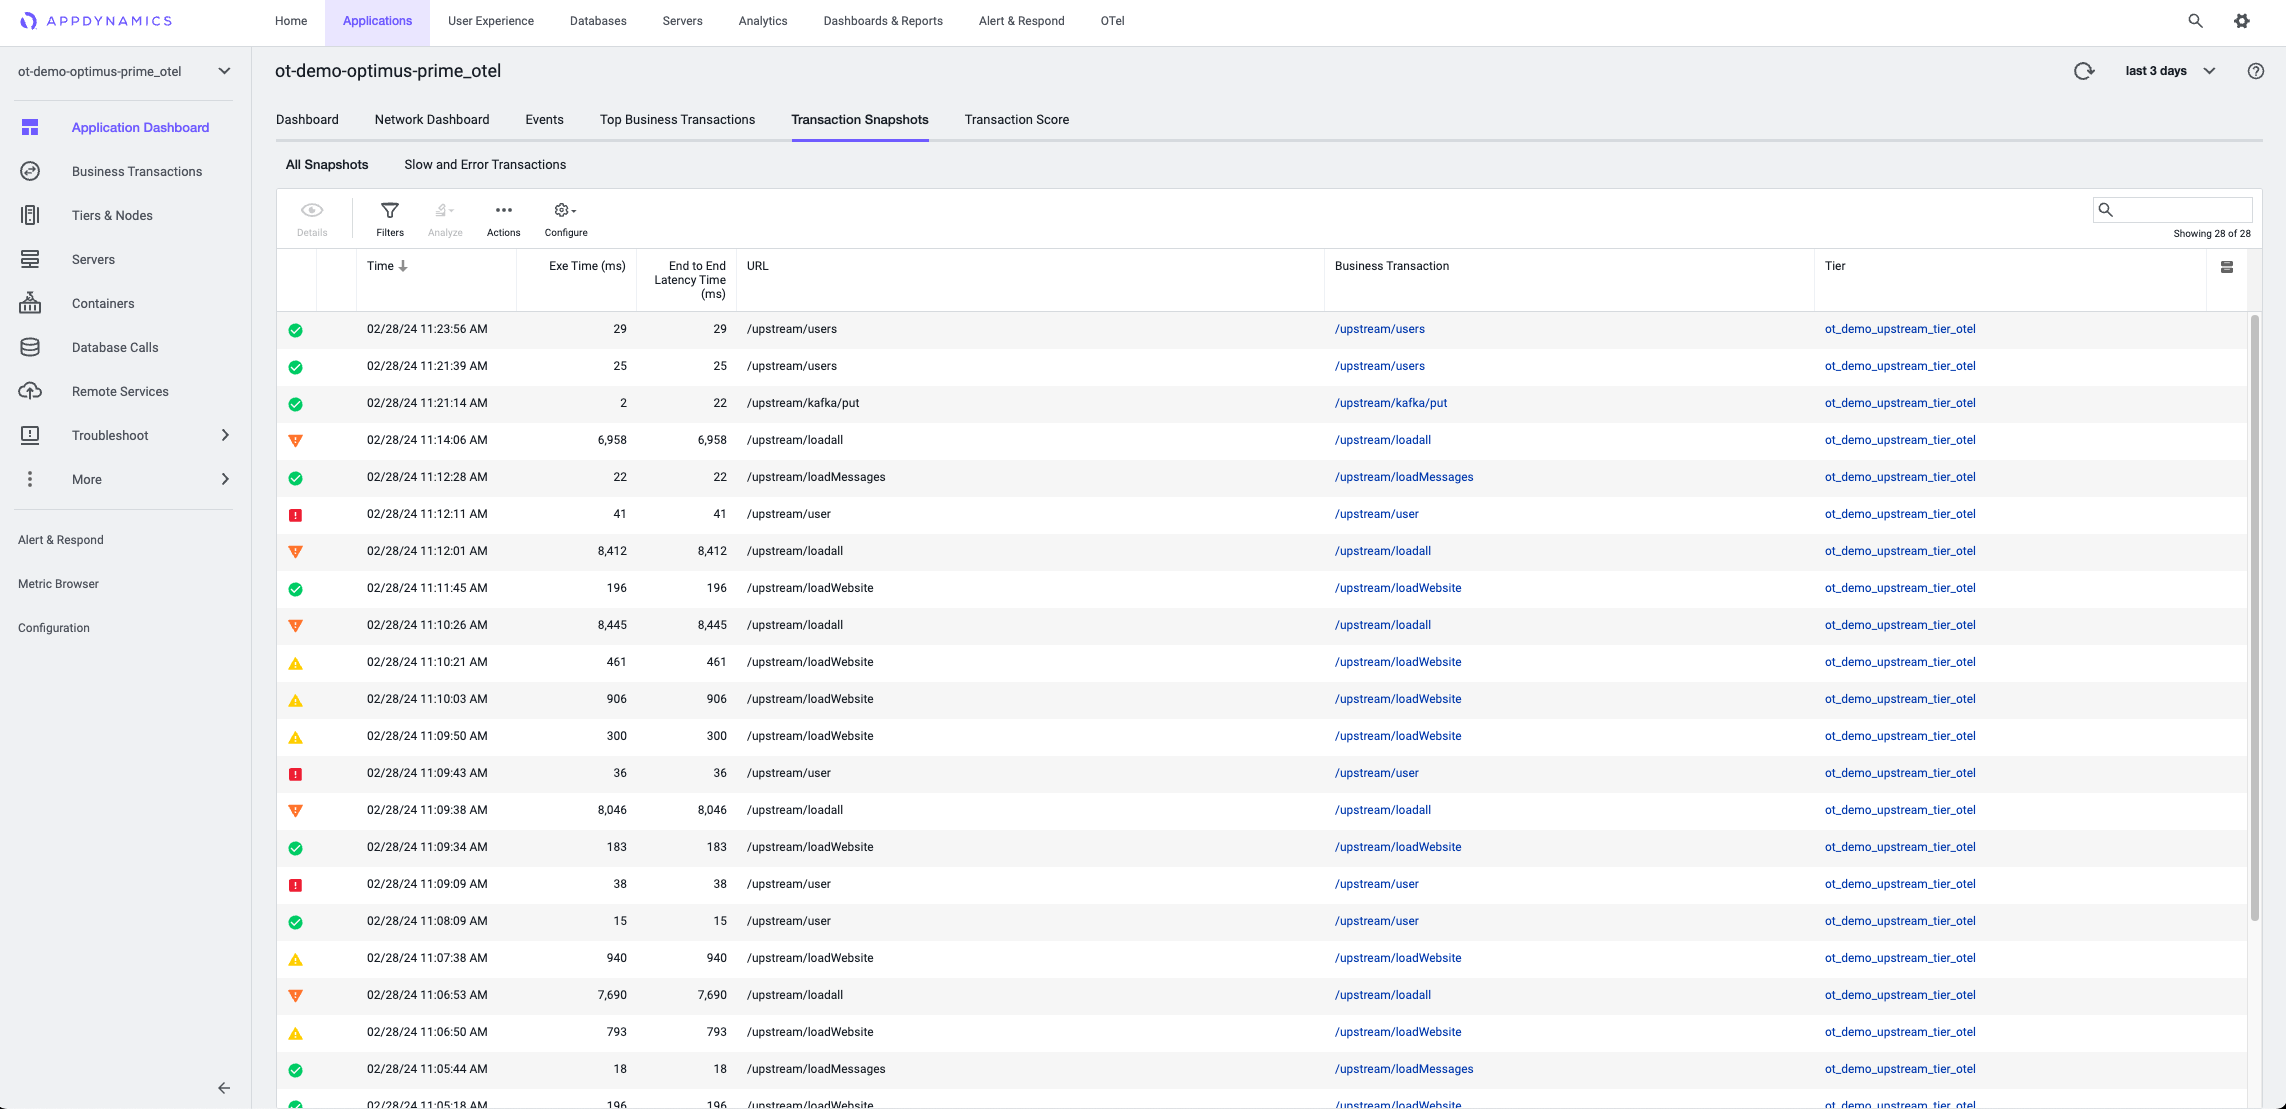
Transaction Snapshots
For OpenTelemetry applications, only ten percent of all tenant traffic is utilized for snapshot processing.
Splunk AppDynamics monitors every execution of a business transaction in the instrumented environment, and the metrics reflect all such executions. For troubleshooting purposes, Splunk AppDynamics takes snapshots of specific instances of a transaction.
A transaction snapshot gives you a cross-tier view of the processing flow for a single invocation of a transaction.
To know more about scenarios that trigger Splunk AppDynamics to capture a transaction snapshot and how to configure transaction snapshot settings, see Transaction Snapshot Collection.
To know more about how to view transaction snapshot data to monitor and troubleshoot business transaction performance, see Troubleshoot Business Transaction Performance with Transaction Snapshots.
In a Transaction Snapshot, the following information is available.
| All Snapshots | Lists all snapshots. A snapshot is captured when a business transaction is slow or the transaction incurs an error. You can perform following actions on the All Snapshots tab:
|
| Slow and Error Transactions | Lists all the slow business transactions and transactions that incurred errors. By default, Splunk AppDynamics considers the following events as errors:
You can perform following actions on the Slow and Error Transactions tab:
|
You can click on a snapshot to further drill-down using the following options and resolve issues. To know more about how to view transaction snapshot data to monitor and troubleshoot business transaction performance, see Troubleshoot Business Transaction Performance with Transaction Snapshots.
| Overview | It provides a summary of the user experience with details such as business transaction name, execution time, and timestamp. You can review the Potential Issues list to see the longest-running method and SQL calls in the transaction. |
| Slow Calls and Errors | It provides details on the slow calls and calls that incurred errors. |
| Waterfall View | Shows the execution of an individual business transaction broken into execution segments. Each segment (shown as a blue bar) represents the time spent executing code on a particular thread within an instrumented application runtime, or the time spent waiting for responses from un-instrumented backends. Handoffs between segments are shown as solid lines for synchronous requests, and dotted for asynchronous requests. The waterfall view allows you to quickly determine which calls consumed the transaction time for a given snapshot. You can click a segment to view the resource wait time for its business transaction. Additionally, you can review downstream applications indicated with the flow map icon. |

Configure User Transaction Thresholds
On Slow Transaction Thresholds > Default Thresholds, you can define the criteria to differentiate among slow, very slow, and stall transactions. The threshold evaluation types can be either static, standard deviation or a percentage (this is applicable to slow and very slow transactions). This change will apply to all the business transactions.
However, if you want to change the criteria for a specific business transaction, click Slow Transaction Thresholds > Individual Transaction Thresholds.

OpenTelemetry™ is a trademark of The Linux Foundation®.