Download page View OpenTelemetry™ Ingestion Data in the Controller UI.
View OpenTelemetry™ Ingestion Data in the Controller UI
The Ingestion Data Usage is a dynamic visual representation of data (traces) that AppDynamics for OpenTelemetry™ ingest in your monitored environment. A trace represents an end-to-end request which can be made up of one or multiple spans. Each span represents one event within a component in the application triggered in the trace. AppDynamics for OpenTelemetry™ ingests and aggregates traces into Business Transaction flow metrics in the Controller UI.
Data Metering Indicators
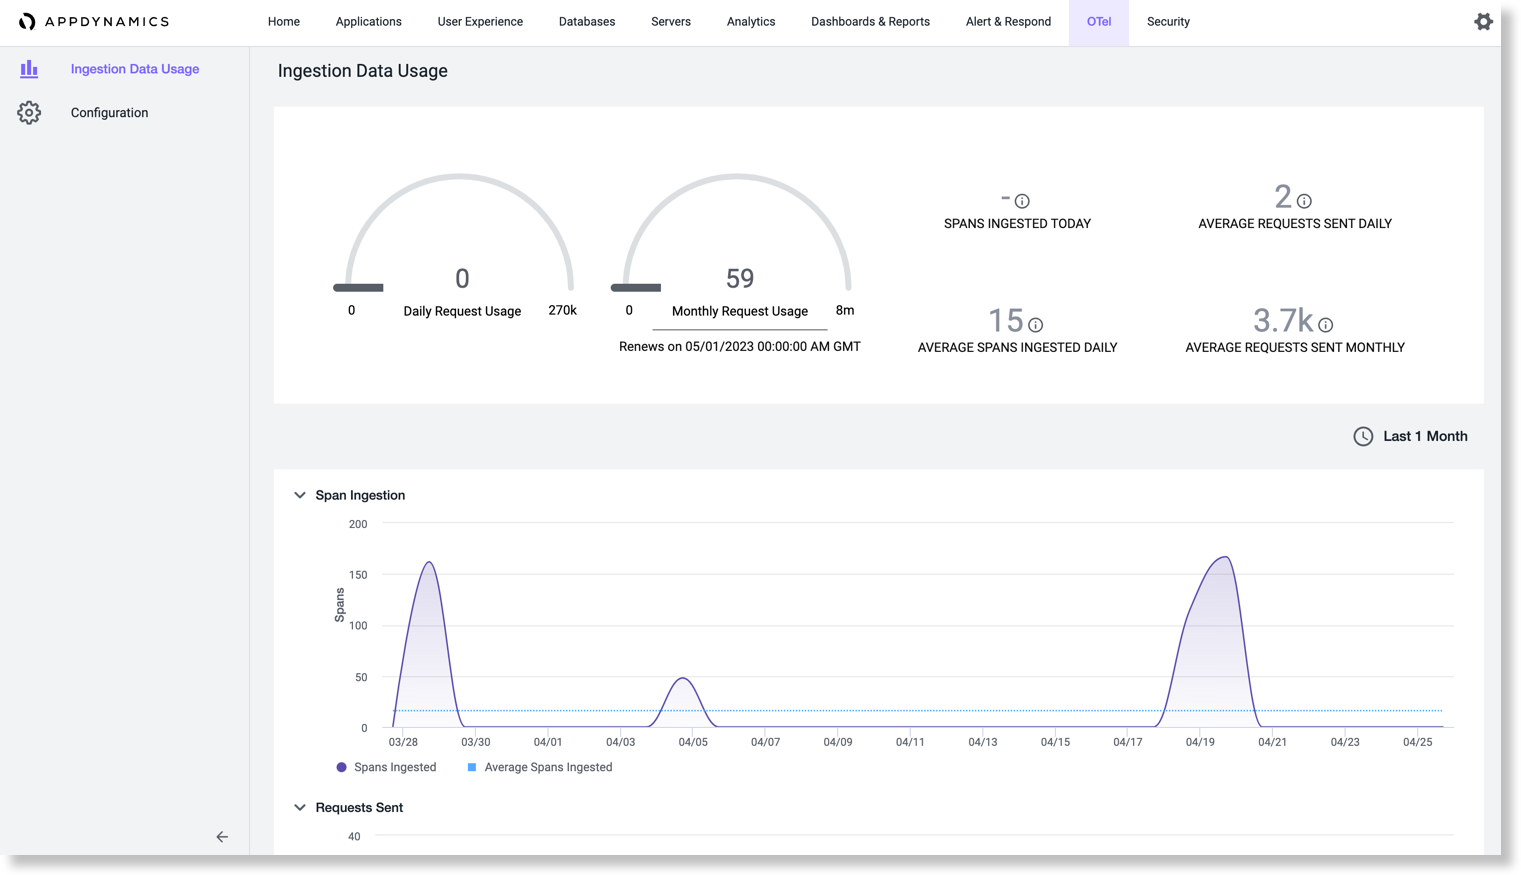
Clicking OTel > Ingestion Data Usage displays the current data usage. The Ingestion Data Usage page displays the following metrics and data metering indicators.
Display Name
Description
Daily Request Usage
The number of OTel data requests ingested by the account in one day. The daily limit is 270 000 requests.
Monthly Request Usage
The number of OTel data requests ingested by the account in one month. The monthly limit is 8 million requests.
Spans Ingested Today
The number of spans ingested in the last 24 hours. There is no limit for spans.
Average Spans Ingested Daily
The average number of spans ingested daily. The average is calculated based on the last 30 days of data.
Average Requests Sent Daily
The average number of OTel data requests sent daily. The average is calculated based on the last 30 days of requests.
Average Request Sent Monthly
The average number of OTel data requests sent monthly. The average is calculated based on the last 90 days of requests.
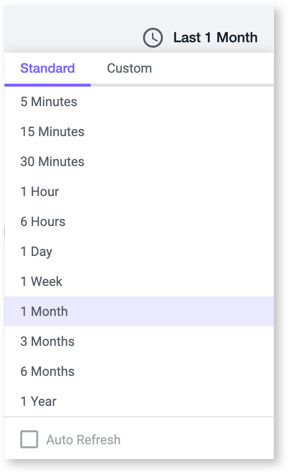
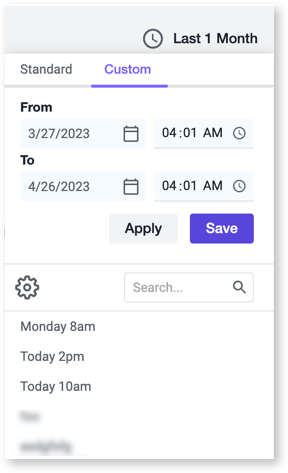
If you do not see any data, adjust the time range accordingly. For example, if the time range is set to Last 1 Hour, change the time range to Last 1 Week or select a custom time range. It will show all spans and requests from the previous seven days.
OpenTelemetry™ is a trademark of The Linux Foundation®.