Download PDF
Download page Monitor the Home Page of Cisco Secure Application.
Monitor the Home Page of Cisco Secure Application
The Home page is the landing page for Cisco Secure Application. This page provides a quick view of the security of the selected application.
By default, this page displays an overview of the selected application. For information about selecting a specific application or service, see Select Application Scope at Monitor Application Security Using Cisco Secure Application.

Business Transactions
The Business Transactions pane includes details to monitor the vulnerability risk of a Business Transaction.
| Field Name | Description |
|---|---|
| Business Transaction | The name of the business transaction. To view the business transaction on the AppDynamics Controller, click the icon next to the name. |
Business Transactions By Risk | The risk score. The higher the value, the higher the risk for the application vulnerability. Business risk is calculated based on the likelihood of vulnerability exploitation, and the impact of the potential exploitation in a business transaction. These are the three statuses: Normal 0-330, Warning 340-660, and Critical 670-1000. |
| Daily Highest Business Risk Score Detected | The highest business risk score detected by Business Risk Score, Warning Threshold, and Critical Threshold. |
| Top Recommended Actions | The top remediations that will reduce the most business risk across all of your business transactions. |
Vulnerabilities
The Vulnerabilities pane includes a real-time trend graph that shows the number of both fixed and open vulnerabilities.
| Chart | Description |
|---|---|
Vulnerabilities By Severity | This chart displays visualization for the number of vulnerabilities based on these severity levels: Critical, High, Medium, and Low. |
Severity Trend | This chart displays the number of open tickets versus the number of fixed tickets. This shows the trend of fixing the open vulnerabilities. |
Days Since First Detected | This chart displays the number of days the vulnerability is open versus the severity of the vulnerability (critical, high, medium, or low). |
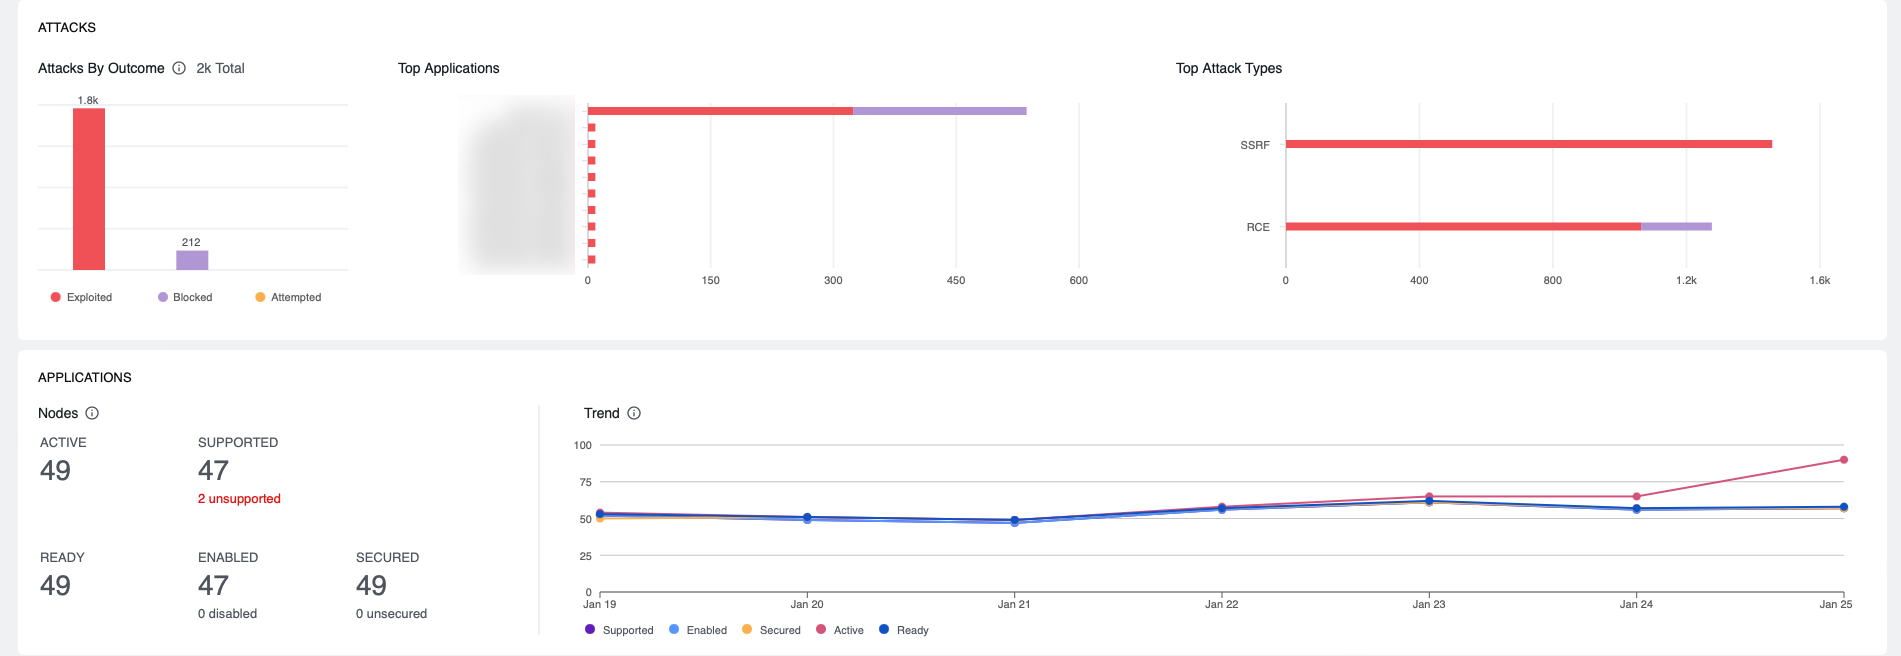
Attacks
The Attacks pane includes the visualization for the number of attacks.
| Chart | Description |
|---|---|
Attacks By Outcome | This chart represents the total number of attacks. This chart displays the number of attacks based on these states: Exploited, Blocked, and Attempted. |
Top Applications | This chart displays the top 10 applications based on attacks per application. For more information about changing the scope of the application, see Monitor Application Security Using Cisco Secure Application. These applications are in either an Exploited, Blocked, or Attempted state. You can hover over each state to view the total number. |
Top Attack Types | This chart displays the top attack types. Attack Types include:
|
Applications
The Applications pane includes the number of nodes of the managed applications.
| Chart | Description |
|---|---|
| ACTIVE | The number highlights the number of nodes that are actively communicating with the AppDynamics Controller. |
| SUPPORTED | The number highlights the number of nodes registered with the Cisco Secure Application. This also displays the number of unregistered nodes. |
| READY | The number highlights the number of nodes that can be successfully registered. |
| ENABLED | The number highlights the total number of nodes that have security enabled for the applications. This also displays the number of nodes on which the security setting is disabled. |
| SECURED | The number highlights the number of secured nodes. This also displays the number of unsecured nodes. |
| TREND | This displays the number of supported, enabled, secured, active, and ready nodes against the day of the month. |
You can click the Export button to download the table data. It downloads all of the rows, columns, and related data in a .csv file. A separate .json file includes the following: link to the Cisco Secure Application website where the table is exported from, global filters (if any) applied to the pages, and search filters applied to the columns. These two files are compressed into a .zip file for downloading. The maximum number of rows that can be exported is 10,000. If table data exceeds 10,000 rows you may apply filters to narrow your search, or export the first 10,000 results.