Browser RUM collects data on every load event that you have instrumented, and it also takes detailed snapshots periodically and when performance issues are detected. Over time, the load event metrics are rolled up based on averages and percentiles. Sometimes you want to see results based on all of the data.
With Browser Analyze, every event is collected and stored for a license specified period in the AppDynamics Platform Events Service. Using the Analyze tab you can see results based on this cumulative data.
The Analyze view is comprised of two tabs:
Access the Browser Analyze View
- Open the application in which you are interested.
- On the left navigation bar, select Analyze.
Records
The Records tab lets you scan individual events and filter and sort to get exactly the data set in which you are interested.
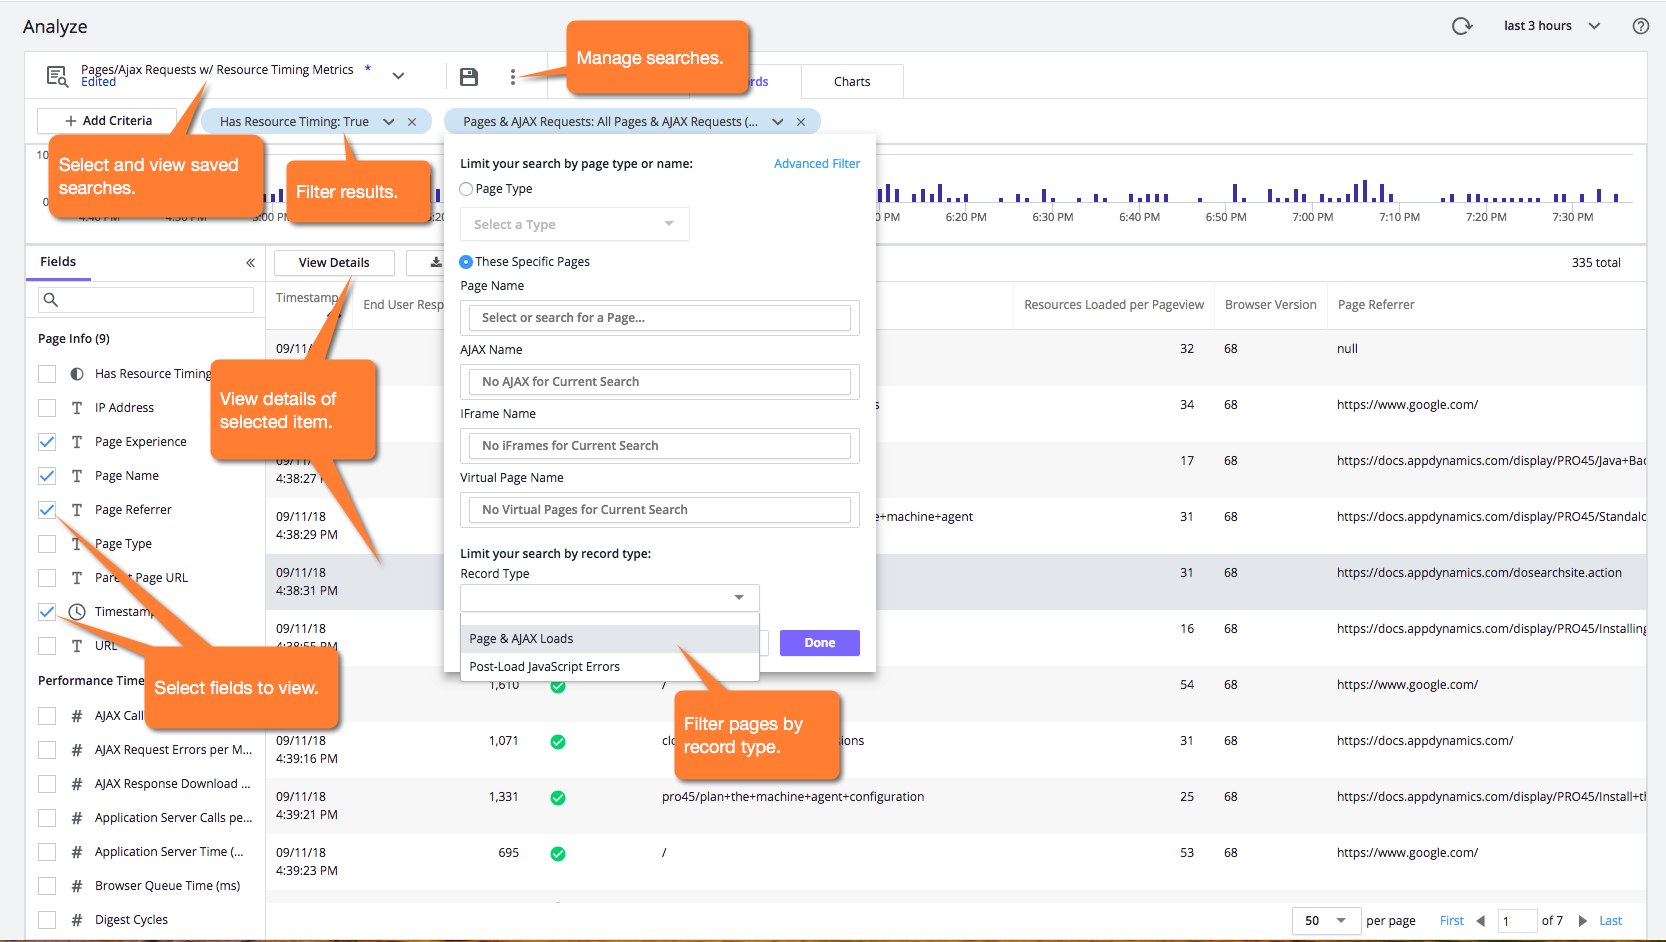
After you click View Details, you see the details of a particular request as a page with a browser session in the Session Details dialog.

Charts
The Charts tab provides you with a set of predefined widgets that offer visualizations of the data set you have created.
You can quickly see how pages, browsers, and geographic location (such as, dimensions) affect the end user response time (EURT). You can also delete, re-add, resize, and drag-and-drop to move all of the widgets.

The time series widgets such as Response Time and End User Response Time use median values, not averages.
Request Number Differences in Browser Analyze and Pages & AJAX Requests
The number of requests for a page over a period of time should be the same in Pages & AJAX Requests and Browser Analyze, but they may vary for these reasons:
- If there are fewer requests given in Browser Analyze, the Events Service, which is responsible for the data in Browser Analyze, has probably not received all of the records yet. To verify this, compare the time of the last request for the page in Browser Analyze and Pages & AJAX Requests. The latter will most likely have a later timestamp.
- If there are more requests given in Browser Analyze, it's possible that the reason is because error records are included in the total number of requests in Pages & AJAX Requests, but listed separately in Browser Analyze. The errors are listed separately in Browser Analyze to enable you to investigate and understand the cause of the error.
Browser Analyze versus Browser Request Analytics
The data shown on the Analyze page is processed and stored by the AppDynamics Platform Events Service. The Charts tab displays a set number of widely used chart types to let you explore your application's performance. A separate product, AppDynamics Application Analytics, has a component called Browser Analytics. This component is based on the same Events Service and uses the same data, but it offers additional capabilities, including:
- Additional predefined widgets, such as the funnel widget
- ADQL for searching the data
- Creating custom widgets
- Manipulating multiple dashboard types
- Longer retention time for data storage
Browser Analytics requires a license separate from the Browser RUM license.
To reduce noise in data stored in the Event Service, Ajax calls from the following tracker domains are no longer published to the Events Service: