This page covers what mobile device metrics are collected, and how to enable collection and view device metrics in the Controller UI.
To learn how Apple's iOS 14 data use policy applies to AppDynamics mobile device metric collection, see iOS Data Collection Disclosure.
Mobile agents can capture the following mobile device metrics:
- Memory (RAM): total memory of the device (i.e. 8GB total memory) and the resource consumption (i.e. 34% of device memory has been consumed)
- Disk Space: total storage capacity of the device (i.e. 64GB total storage capacity) and storage usage (i.e. 65% of device storage has been consumed)
- Battery: battery level of the device (i.e. 50% battery)
Support
- Available for both SaaS and on-premise deployments
- Controller >= 20.11.0
- Android Agent >= 20.10.0
- iOS Agent >= 20.10.0
To configure device metric data collection in the Controller UI:
- Go to a browser application.
- In the left-hand panel, go to Configuration > Mobile App Group Configuration > Settings.
Under Configure Mobile Device Metrics, enable each metric type. It may take a few minutes for data to appear on the Mobile App Dashboard.
Set Frequency of data collection to how often device data is collected for the options you enabled. For example, if the frequency is set to 2, every 2 minutes the enabled device data is collected and shown in the dashboard widgets.
Warning
The maximum frequency is 2 minutes and collects the most data. However, sessions under 2 minutes or temporary metric spikes will not be captured.
You can view device metric widgets on the Mobile App Dashboard. To add device metric widgets:
- Go to the Mobile App Dashboard.
- In the top-left corner, click +.
- Add the widgets Device Memory Capacity, Device Storage Capacity, and Device Battery Capacity.
- Click on a widget and view performance and sessions by battery, memory, and storage.
View Sessions with Device Metrics
On the Sessions dashboard, you can add columns to sort sessions for each device metric. To add device metric columns:
- Go to Mobile Session Fields.
- Check the fields Critical Battery Usage, Critical Memory Usage, and Critical Storage Usage.

Filter Sessions by Device Metric Values
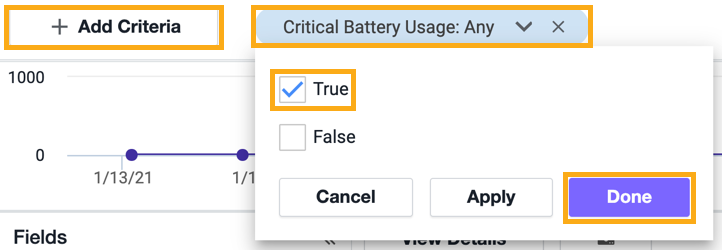
You can filter sessions by critical device states you configured. For example, if you want to look at sessions with low device battery:
- Go to Sessions.
- Click + Add Criteria.
- Select "Critical Battery Usage: Any".
- Check "True."

Set Critical Usage Thresholds
You can set the usage threshold to trigger a critical event. To configure what usage percentage triggers a critical event:
- Go to Configuration > Mobile App Group Configuration > Settings.
Under Configure Mobile Device Metrics, enter a value for each device metric threshold. For example, if you want to capture battery usage below 50%, set Enable Battery Usage and Capacity Metrics to 50%. When that configured threshold is reached, the resource consumption (percentage value) is captured by the agent and shown in session data.
When you look at a mobile session, you can see the critical events you configured.

Known Issues
For Android devices, memory reported in the UI may not match the actual end-user device memory. Due to API limitations, the memory value that the Android Agent returns might not include segments on the device's reserved memory. For example, an Android device might have 64GB storage and 8GB memory, but the Android Agent might report only 53GB storage and 6.5GB memory. This discrepancy varies based on device type and manufacturer.