Download page Enable Log Collection for Failing Pods.
Enable Log Collection for Failing Pods
This page describes how to enable and use the Cluster Agent feature to collect logs for failing pods. This feature is automatically enabled on SaaS Controllers. You must enable on-premises Controllers described on this page.
When enabled, the Cluster Agent automatically collects logs for restarted or failed pods. The pod failure logs capture the status of the CrashLoopBackoff events that display the Back-off restarting failed container message. This message usually indicates that Kubernetes started a container but then the container quickly exits. If this occurs, Kubernetes attempts to restart the container. You can use these log messages to determine why the pod is exiting, whether due to a liveness probe, or some other issue.
Minimum Requirements
The Cluster Agent log collection feature requires:
Cluster Agent >= 20.7
Controller >= 20.10.0
Requirements to Enable On-Premises Controllers
Enable logging by using the Cluster Agent configuration setting, sim.cluster.logs.capture.enabled.
Update the full file path to store the logs using the Controller setting, sim.cluster.logs.root.file.path. The logs are stored in the specified file location.
Ensure you have 50 GB of hard disk space on the file system.
When updating the file path, ensure that you move previously collected logs from the old path to the new path to view them on the Controller UI.
Controller Settings
The following table lists the log settings required for an on-premises environment:
For SaaS, the Technical Support team updates the configuration properties. Therefore, to configure the logs for SaaS, contact the support team by creating an AppDynamics Support ticket.
Setting
Definition
Location
Default
sim.cluster.logs.bucket.name
The folder name to store the pod logs.
Controller Administration Console with root user permission (Controller Settings)
kubernetes-log-snippets
sim.cluster.logs.capture.enabled
An option to enable or disable log capturing.
This option is enabled by default.
Controller Administration Console with root user permission
You can configure this setting at both account level (Account Settings) and Controller level (Controller Settings)
true
sim.cluster.logs.expiration.in.days
The number of days after which the logs get cleared from the storage.
Controller Administration Console with root user permission (Controller Settings)
10
sim.cluster.logs.root.file.path
The complete root file path to store the logs. Modifying the path results in storing the logs in the new path but the older logs will remain in the previous location.
Controller Administration Console with root user permission (Controller Settings)
/opt/appdynamics
sim.cluster.failed.pod.limit
The number of historical pods beyond this value is purged.
Controller Administration Console with root user permission (Controller Settings)
1000
Use Cluster Agent Log Collection
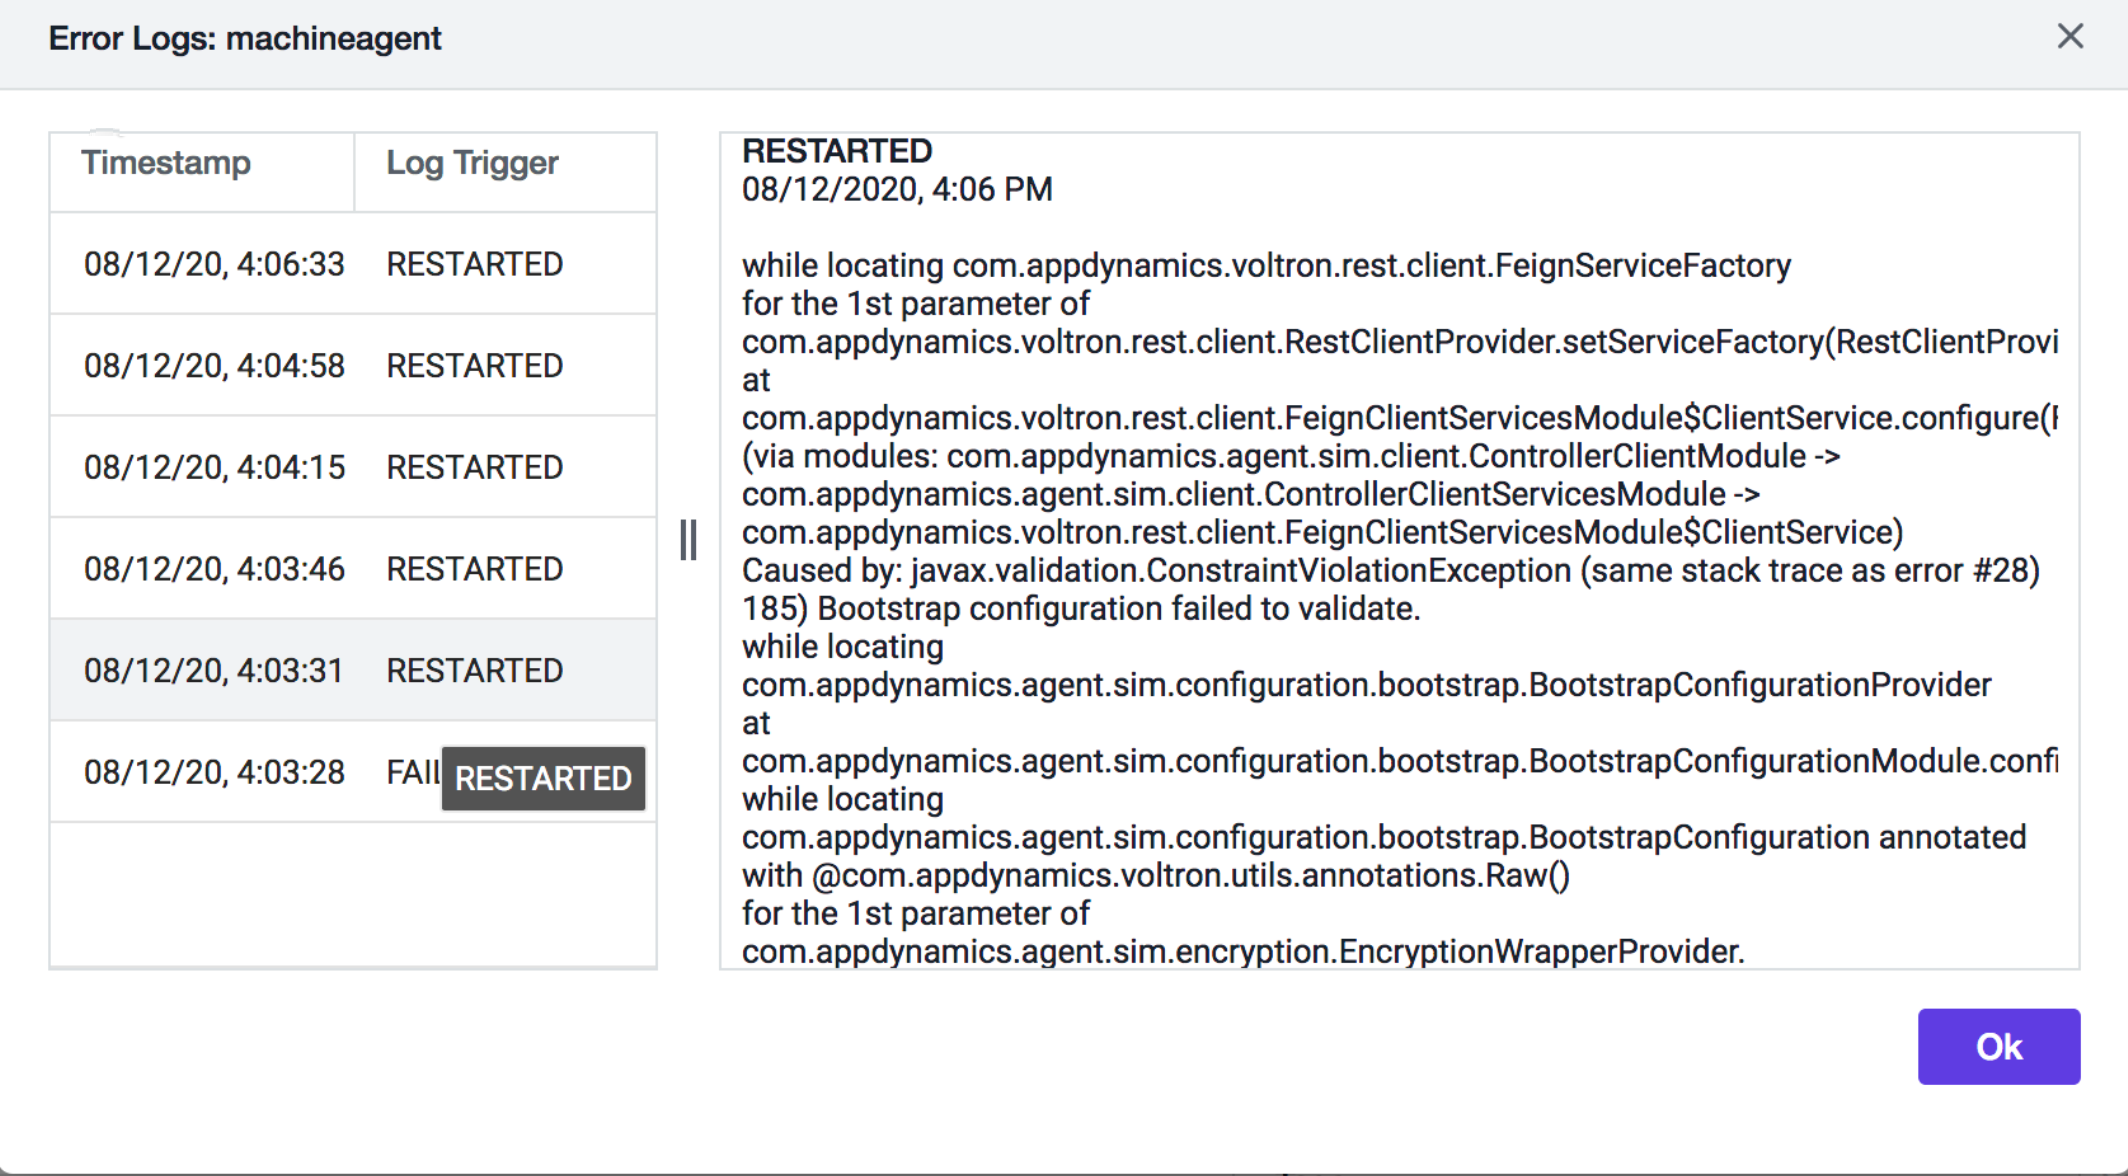
You can view the logs on the Pod Details page and the Cluster Event page.
Pod Details Page
Select Servers > Clusters > Cluster Name.
Select a Cluster Agent and double-click. The cluster interface displays the Dashboard, the Pods, the Inventory, and the Events tabs.
Click Pods.
Double-click any pod to display its Pod Details panel.
Review the Error Log.
Click the Actions icon to view the log details.
Cluster Events Page
Click the Servers tab.
On the left navigation bar, select Events to see a list of events that have been reported from both servers and clusters. or Select Clusters > <Clustername> > Details > Events
Double-click a cluster event to view the logs under the Logs tab.