Download PDF
Download page Browser RUM Metrics.
Browser RUM Metrics
Key Browser RUM metrics display on the Geo, Pages & AJAX Requests, and Usage Stats dashboards. They are also visible on the All Pages and Top Pages lists and in the Metric Browser.
In addition, the Metric Browser enables you to view these metrics in the context of Ajax requests, Iframes, applications, base pages, browsers, devices, and geographic locations.

You can build custom health rules based on Browser RUM Page, Ajax, and Iframe metrics in the health rule builder. Use these rules to automatically monitor key metrics in your installation. See Health Rules.
Browser RUM Timing Metrics Overview
The following provides an overview of the first Browser RUM page and Iframe timing metrics. For key Ajax metrics, see Ajax Metrics Availability. Metrics in blue are available only from NavTime browsers. You may see a value of unknown for some metrics taken using older browsers.
When users begin to load the first instrumented page, the JavaScript Agent starts a timer. The timer or the NavTime responseStart starts the first-page timing.
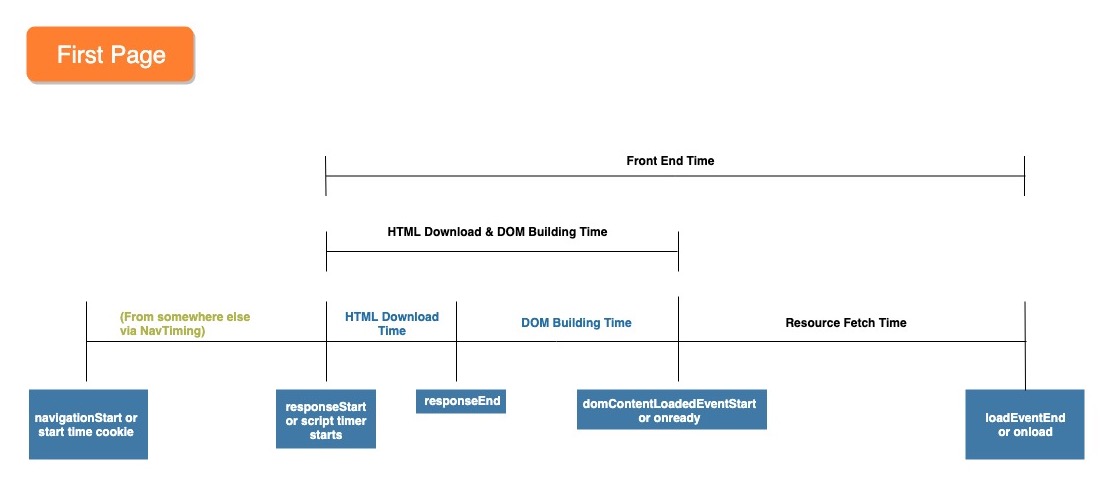
Because a NavTime browser always sets navigationStart, you can retrieve this information even on the first page a user loads from your site.
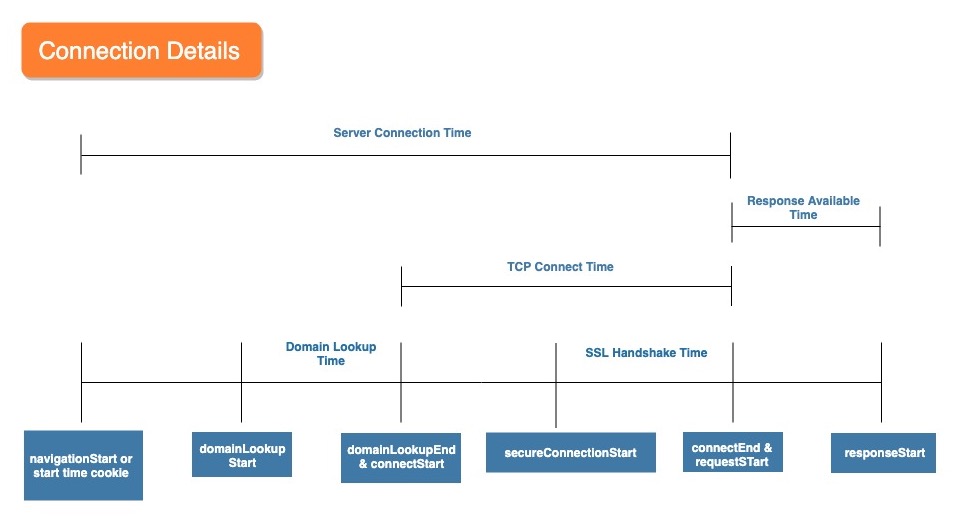
NavTiming-capable browsers also provide highly granular information on connection details.
Timing Metric Definitions
Timing metrics are the average times, in milliseconds, over the time range selected in the Controller UI or REST API call. The three-letter abbreviation is the short name as it is recorded in the web beacon.
| Name (Short Name) | NavTiming Capable Browsers1 | Browsers without NavTiming Support | Available For . . . | Definition |
|---|---|---|---|---|
| Ajax Callback Execution Time (DPT) |
| responseEnd to domContentLoadedEventStart (context of the Ajax object) | Ajax Requests (XHR, Fetch API) | Time for the browser to process the Ajax response. |
| Ajax Response Download Time (DDT) | responseStartf to responseEnd(context of the Ajax object) |
| Ajax Requests (XHR, Fetch API) | Time for the browser to download the complete Ajax response. |
Ajax Request Errors per Minute (Short name based on |
| Total number of Ajax requests that generate an error per minute. | ||
Ajax Requests per Minute (Short name based on |
| Total number of Ajax requests per minute. | ||
| Application Server Calls per Minute |
| Number of requests that actually hit the application server, rather than a cache. | ||
| Application Server Time (also called Server Time in the UI) |
| Processing time for requests on the application server. | ||
| Browser Queue Time |
| |||
| DOM Building Time (DPT) | responseEnd to domContentLoadedEventStart | N/A |
| Time for the browser to build the Document Object Model (DOM) and make it available for JavaScript to apply rendering logic. |
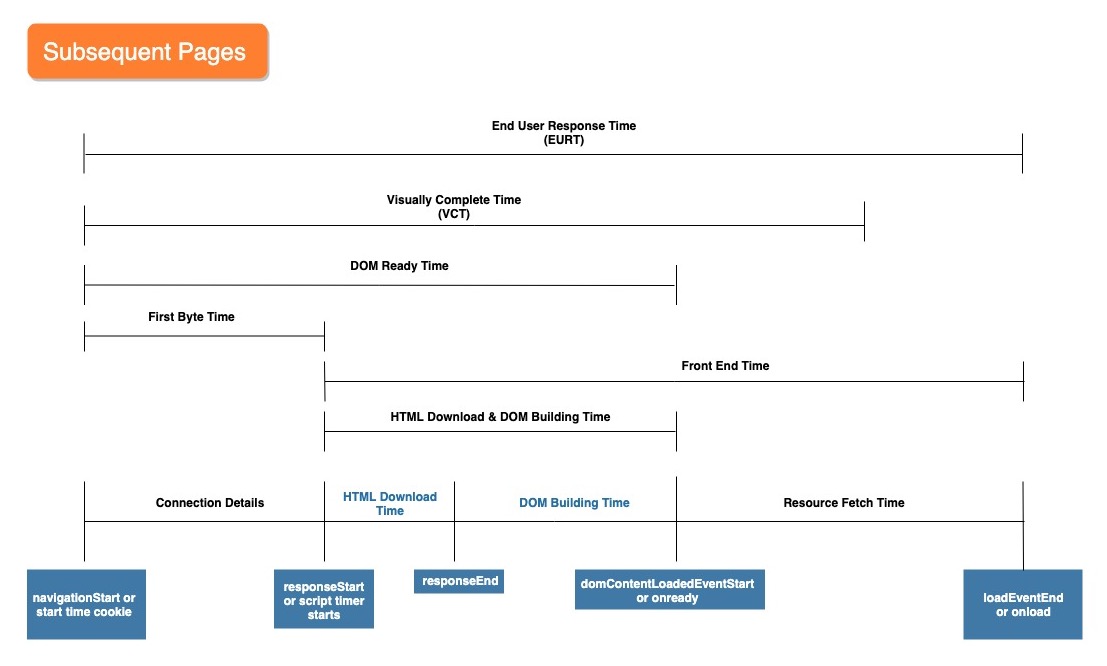
| DOM Ready Time (DOM)2 | navigationStart to domContentLoadedEventStart | Time between the writing of the |
| Interval between the time that a user initiates a request and the time that the DOMContentLoaded event (or the internal handler's onready event) occurs. |
| Domain Lookup Time (DNS) | domainLookupStart to domainLookupEnd | N/A |
| Time to complete the domain lookup portion of the server connection time. |
End User Response Time (PLT)2 | navigationStartto loadEventEnd | Time between the writing of the |
| Average interval between the time that a user initiates a request and the completion of the page load of the response in the user's browser. In the context of an Ajax request, it ends when the response has been completely processed. For information about End User Response Time for SPA2 pages, see SPA2 Metrics. |
First Byte Time (FBT)2 | navigationStart to responseStart | Time between the writing of the |
| Interval between the time that a user initiates a request and the time that the browser receives the first response byte. In the context of an Ajax request, First Byte Time is the interval between the Ajax request dispatch and the time that the browser receives the first response byte. |
| Front End Time (FET) | responseStart to loadEventEnd | Time between when the page's JavaScript Agent begins executing and the onload event. |
| Interval between the arrival of the first byte of text response and the completion of the response page rendering by the browser. Includes HTML Download, DOM Building Time, and Resource Fetch Time. |
| HTML Download and DOM Building Time (DRT) | responseStart to domContentLoadedEventStart | Time between when the page's |
| Time to make the complete HTML document (DOM) available for JavaScript to apply rendering logic. Includes the HTML Download and the DOM Building Time. |
| HTML Download Time (DDT) | responseStart to responseEnd | N/A |
| Time for the browser to download the complete HTML document content. |
Iframe Requests per Minute (Short name based on |
| Total number of Iframe requests per minute. | ||
| Images Loaded per Pageview |
| Total number of images in a Calculated after page has completely loaded. | ||
Page Complete Time (PCT) | N/A | N/A |
| Total time for the browser to render all visual page elements (both in and out of the viewport). Available for SPA base pages only. For information about Page Complete Time for SPA2 pages, see SPA2 Metrics. |
Page Requests per Minute (Short name based on |
| Total number of Page requests per minute. This is the metric displayed across most of the UI. | ||
Page views with JavaScript Errors per minute (Short name based on |
| Total number of page views that contain JavaScript errors per minute. | ||
| Resource Fetch Time | domContentLoadedEventStartto loadEventEnd | Time between an internal handler's onready event, similar to jquery.onready(), and onload. |
| Time for the browser to complete the download of remaining resources, including images, and finish rendering the page. |
| Resources Loaded per Pageview |
| Total number of resources in a Calculated after the page has completely loaded. | ||
Requests per Minute (Short name based on |
| Total number of requests (Page + Ajax + Iframe) per minute. | ||
| Scripts Loaded per Pageview |
| Total number of scripts in a Calculated after the page has completely loaded. | ||
| Server Connection Time (SCT) | navigationStart to requestStart | N/A |
| Interval between the time that a user initiates a request and the start of fetching the response document from the server or application task. Includes the time spent on redirects, domain lookups, TCP connects and SSL handshakes. |
| SSL Handshake Time (SSL)3 | secureConnectionStart to connectEnd | N/A |
| Time taken to complete the SSL handshake. |
| TCP Connect Time (TCP) | connectStart to connectEnd | N/A |
| Time to complete the TCP connect portion of the server connection time, the equivalent of one network roundtrip of latency. |
| Total Resource Redirect Time |
| Time for all redirects associated with fetching resources. Calculated after the page has completely loaded. | ||
Visually Complete Time (VCT) | N/A | N/A |
| Total time for all visual elements within the first screen (above-the-fold content) to load in an end user’s browser. For information about Visually Complete Time for SPA2 pages, see SPA2 Metrics. |
Ajax Metrics Availability
Because Ajax requests occur in the context of the larger page, these four core metrics are always available, regardless of the browser type.

For more information on which browsers support the Navigation Timing API, see the Can I Use website.
Resource Timing Metrics
Resource timing metrics are the median times in milliseconds. The resource timing metrics shown in the Resource Performance Dashboard are raw data. For a visual representation of the resource timing, see the Resource Timing Overview diagram.
| Metric Name | How It's Calculated | Description |
|---|---|---|
| Browser Wait | startTime or redirectEnd to fetchStart | Time from the redirection or request start until the browser begins to fetch the resource. |
| Redirect Time | redirectStart to redirectEnd | Time for all redirects associated with fetching resources. |
| DNS Wait Time | fetchStart to domainLookupStart | Time from when the browser starts to fetch the resource until the browser starts the domain name lookup for the resource. |
| DNS Time | Time to complete the domain lookup portion of the server connection time. | |
| TCP Wait Time | domainLookupEnd to connectStart | Time for the browser to find the domain name for the resource before a connection is made. |
| Connection Time | connectStart to connectEnd | Time to complete the establish the TCP connection for a resource: the equivalent of one network roundtrip of latency. |
| SSL Time |
(if | Time to establish a secure connection to the server. |
| Request Wait Time | Time for the request is made for a resource from the server, cache, or local resource before the connection is closed. | |
| Request Time | requestStart to responseStart | Time for the browser to complete the request for a resource from the server, cache, or local resource. |
| Response Time | responseStart to responseEnd | Time for the browser to download the complete HTML document content. In the context of an Ajax request, the time for the browser to download the complete Ajax response. |
| First Byte Time | startTime to responseStart | Time from when the request is made until the first byte of the resource is received by the browser. |
| Resource Load Time | startTime to responseEnd | Time for the browser to start a request and receive a response for a resource. |
| Browser Queue Time | Browser Wait + DNS Wait Time + Request Wait Time | Total wait time of the resource. |
| TCP Time | secureConnectionStart to connectStart | Time spent to establish a secure connection to the server (same as SSL Time). |
Configure Timing Metrics
If your application continuously sends Ajax requests or resources, you may want to configure the default JavaScript timing metrics below.
For example, if in your SPA2 app the Ajax requests are sent at a faster rate (i.e 2 seconds) than the default maxInactive time (3 seconds), the Page Load Time metric could be incorrectly inflated. To fix this, you could configure maxInactiveTime to 2 seconds so Page Load Time matches the rate of the Ajax requests.
maxResourceQuietTime
If all registered resources are loaded and the time elapsed between currentTime and last resource load time is >= maxQuietTime, the resource observer stops.
(function(config){
   config.navComplete = {
                maxResourceQuietTime: 5000 // For SPA2 applications, the default value is 5000 (5 seconds). For non-SPA applications, the default value is 1000 (1 		    second).
            };
})(window['adrum-config'] || (window['adrum-config'] = {})); maxXhrQuietTime
If all XHRs are successful and the time elapsed between currentTime and last XHR load time is >= maxQuietTime, the XHR observer stops.
(function(config){
   config.navComplete = {
                maxXhrQuietTime: 3000 // For SPA2 applications, the default value is 3000 (3 seconds). For non-SPA applications, the default value is 1000 (1 second).
            };
})(window['adrum-config'] || (window['adrum-config'] = {})); About timing metrics and NavComplete
maxResourceQuietTime and maxXhrQuietTime contribute toward the page observation period to be marked complete (navComplete). There are two ways for navComplete to occur:
- Both the XHR observer (
maxXhrQuietTime) and the resource observer (maxResourceQuietTime) have stopped running. - The time elapsed since the last download activity has exceeded the
maxQuietTime. This means enough time has passed since the latest resource or XHR load.
Once either of these scenarios is reached, the JavaScript Agent will consider the page to be complete, mark the timing as Visually Complete Time, and report the page to AppDynamics.
maxInactiveTime
maxInactiveTime is the current time minus when the last resource (i.e. Ajax call) happened. If this value is greater than maxInactiveTime, the navigation observer is assumed complete and the Visually Complete Time value is sent.
(function(config){
   config.navComplete = {
                maxInactiveTime: 3000 // For SPA2 applications, the default value is 3000 (3 seconds). For non-SPA applications, the default value is 1000 (1 second).
            };
})(window['adrum-config'] || (window['adrum-config'] = {}));