Download PDF
Download page Synthetic API Monitoring.
Synthetic API Monitoring
Synthetic API monitoring enables you to monitor the availability and performance of HTTP(s) based APIs. These APIs can be internal, external, or third-party APIs and from different geo-locations across the globe. You can monitor private and public APIs in these scenarios:
- Private APIs
- APIs exposed by the microservices or web services
- APIs used for communication between webpage (frontend) and backend
- Public APIs
- APIs exposed to customers
- Third-party APIs such as payment gateways and maps
- Partner APIs
API Collection
An API collection is a group of all the APIs or API jobs in a microservice or application.
The API collection view displays these API details:
- Average availability
- Total API requests
- Average response time
You need access to API collection to add, view, or delete the API collection.

API Jobs
You can use an API job to monitor a single API or a sequence of APIs. You can use JavaScript to create API jobs.
Sample JavaScript
(async () => {
    // GET Request
    var response = await client.get("https://www.google.com/");
    console.log(response.statusCode); // 200
    console.log(response.statusMessage); // OK
    console.log(response.body); // HTML Body

    // POST, PUT or DELETE Request
    response = await client.post("https://www.google.com/");
    response = await client.put("https://www.google.com/");
    response = await client.delete("https://www.google.com/");
})(); // Make sure to call the async function at the end.Using JavaScript, you can implement various authentication mechanisms, encrypt the payload, parse the response, and validate the response time, response size, response content, and so on.
You can store the credentials required for API authentication in the Synthetic credential vault, and use them in JavaScript.
For more JavaScript examples, see API Monitoring scripts.
You can configure API Jobs to:
- Trigger alert events based on performance issues.
Execute API jobs periodically from the configured locations. You can configure the jobs to execute in any timezone on any day, and time of the week. The minimum frequency support for API monitoring is one minute.
- Configure timeout to cause jobs to fail when the time to execute the jobs exceeds a specified duration. By default, the API jobs timeout when the job execution does not complete within five minutes. Jobs that fail due to timeout indicate an availability issue.
- Trigger warning or critical error events based on the response time of the API jobs. You can also configure the warning or critical events to retest a specific number of times before triggering the events to avoid false positives. See Health Rule Violation Events to view the event status of a failure event.
You can execute API jobs from any of the 17 AWS Locations; in each location, or in one location per execution interval.
See Configure API Monitoring Jobs.
You can update the job configuration to change how the API job is executed. Create a new job, or select an existing job and click Edit to update the configuration.

The list of all the created API jobs is available in the API Jobs list view. You can view the availability and performance trends of these API jobs in this view. Use the time window filter to display the API jobs trends of a particular time interval.
The API Jobs list view also displays the average response size, the number of executed locations, and the number of executions in the selected time interval.

Session List
Each execution of the API jobs is available in the Jobs Sessions view.
The Records tab displays the availability trend of the selected API job at the top. The list of each API job execution displays below the availability trend. You can use the filter option to filter the jobs based on specific criteria and focus on issues during troubleshooting.

A job-level duration is the time required to execute a job script. However, the duration displayed under the APIs page is the time required to execute a particular API.
Click on a particular session to view the API details and response details.
API Details: Displays additional details, such as the start time, end time, and duration of the following parameters:
- Wait
- DNS
- TCP
- Request
- First byte
- Download
- Total
Response Details: Displays the following details:
- Status code
- Response time
- Response size
- Response details
- Response payload
If any API fails, the error details are displayed, and the reason if the system can identify the cause. The response payload is displayed for the successful APIs.
Response payload is displayed after the job executes for less than an hour.
The Charts tab displays the availability trend, response time trend, and response size trend of the selected API jobs.

Users without the administrator role cannot view the session data. If you want a user to provide view permissions to the session data, perform the following steps:
- Navigate to
 > Administration > Roles.
 - Select the role and click Analytics.
- Under Events, select Synthetic Sessions from the Type dropdown.
If you want the users to view session data of only specific collections, then click Add under Can view synthetic data from the following App Keys and select the app keys.
Click Save.
Users that are assigned to this role can view the session data.
Session Details
The detail of each API job execution is available on the Session Details page. The Session Summary displays the session size, session time, and location.
On the left-hand side, the page displays the status code, method used, and URL of the API requests.
On the right-hand side, the page displays the information of each API executed in the API job. The start time, end time, and the duration of these parameters for each API are available on this page:
- Wait
- DNS
- TCP
- SSL and TLS
- Request time
- First byte
- Download time
- Total time
API Summary
The APIs page provides a summary of all the APIs across different jobs. It displays the number of requests, response size, and duration of the APIs. You can filter the time range for which you want to see the data.
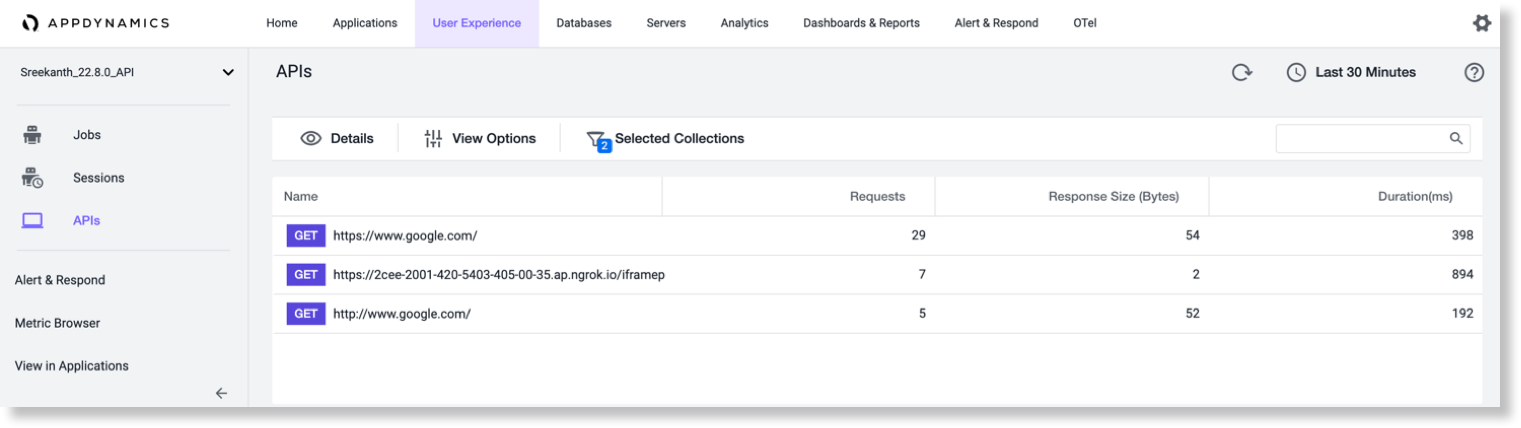
API duration is different than the job duration. The API duration is the time required to execute a particular API. However, the duration displayed under the Sessions page is the time required to execute a job script.
API Details
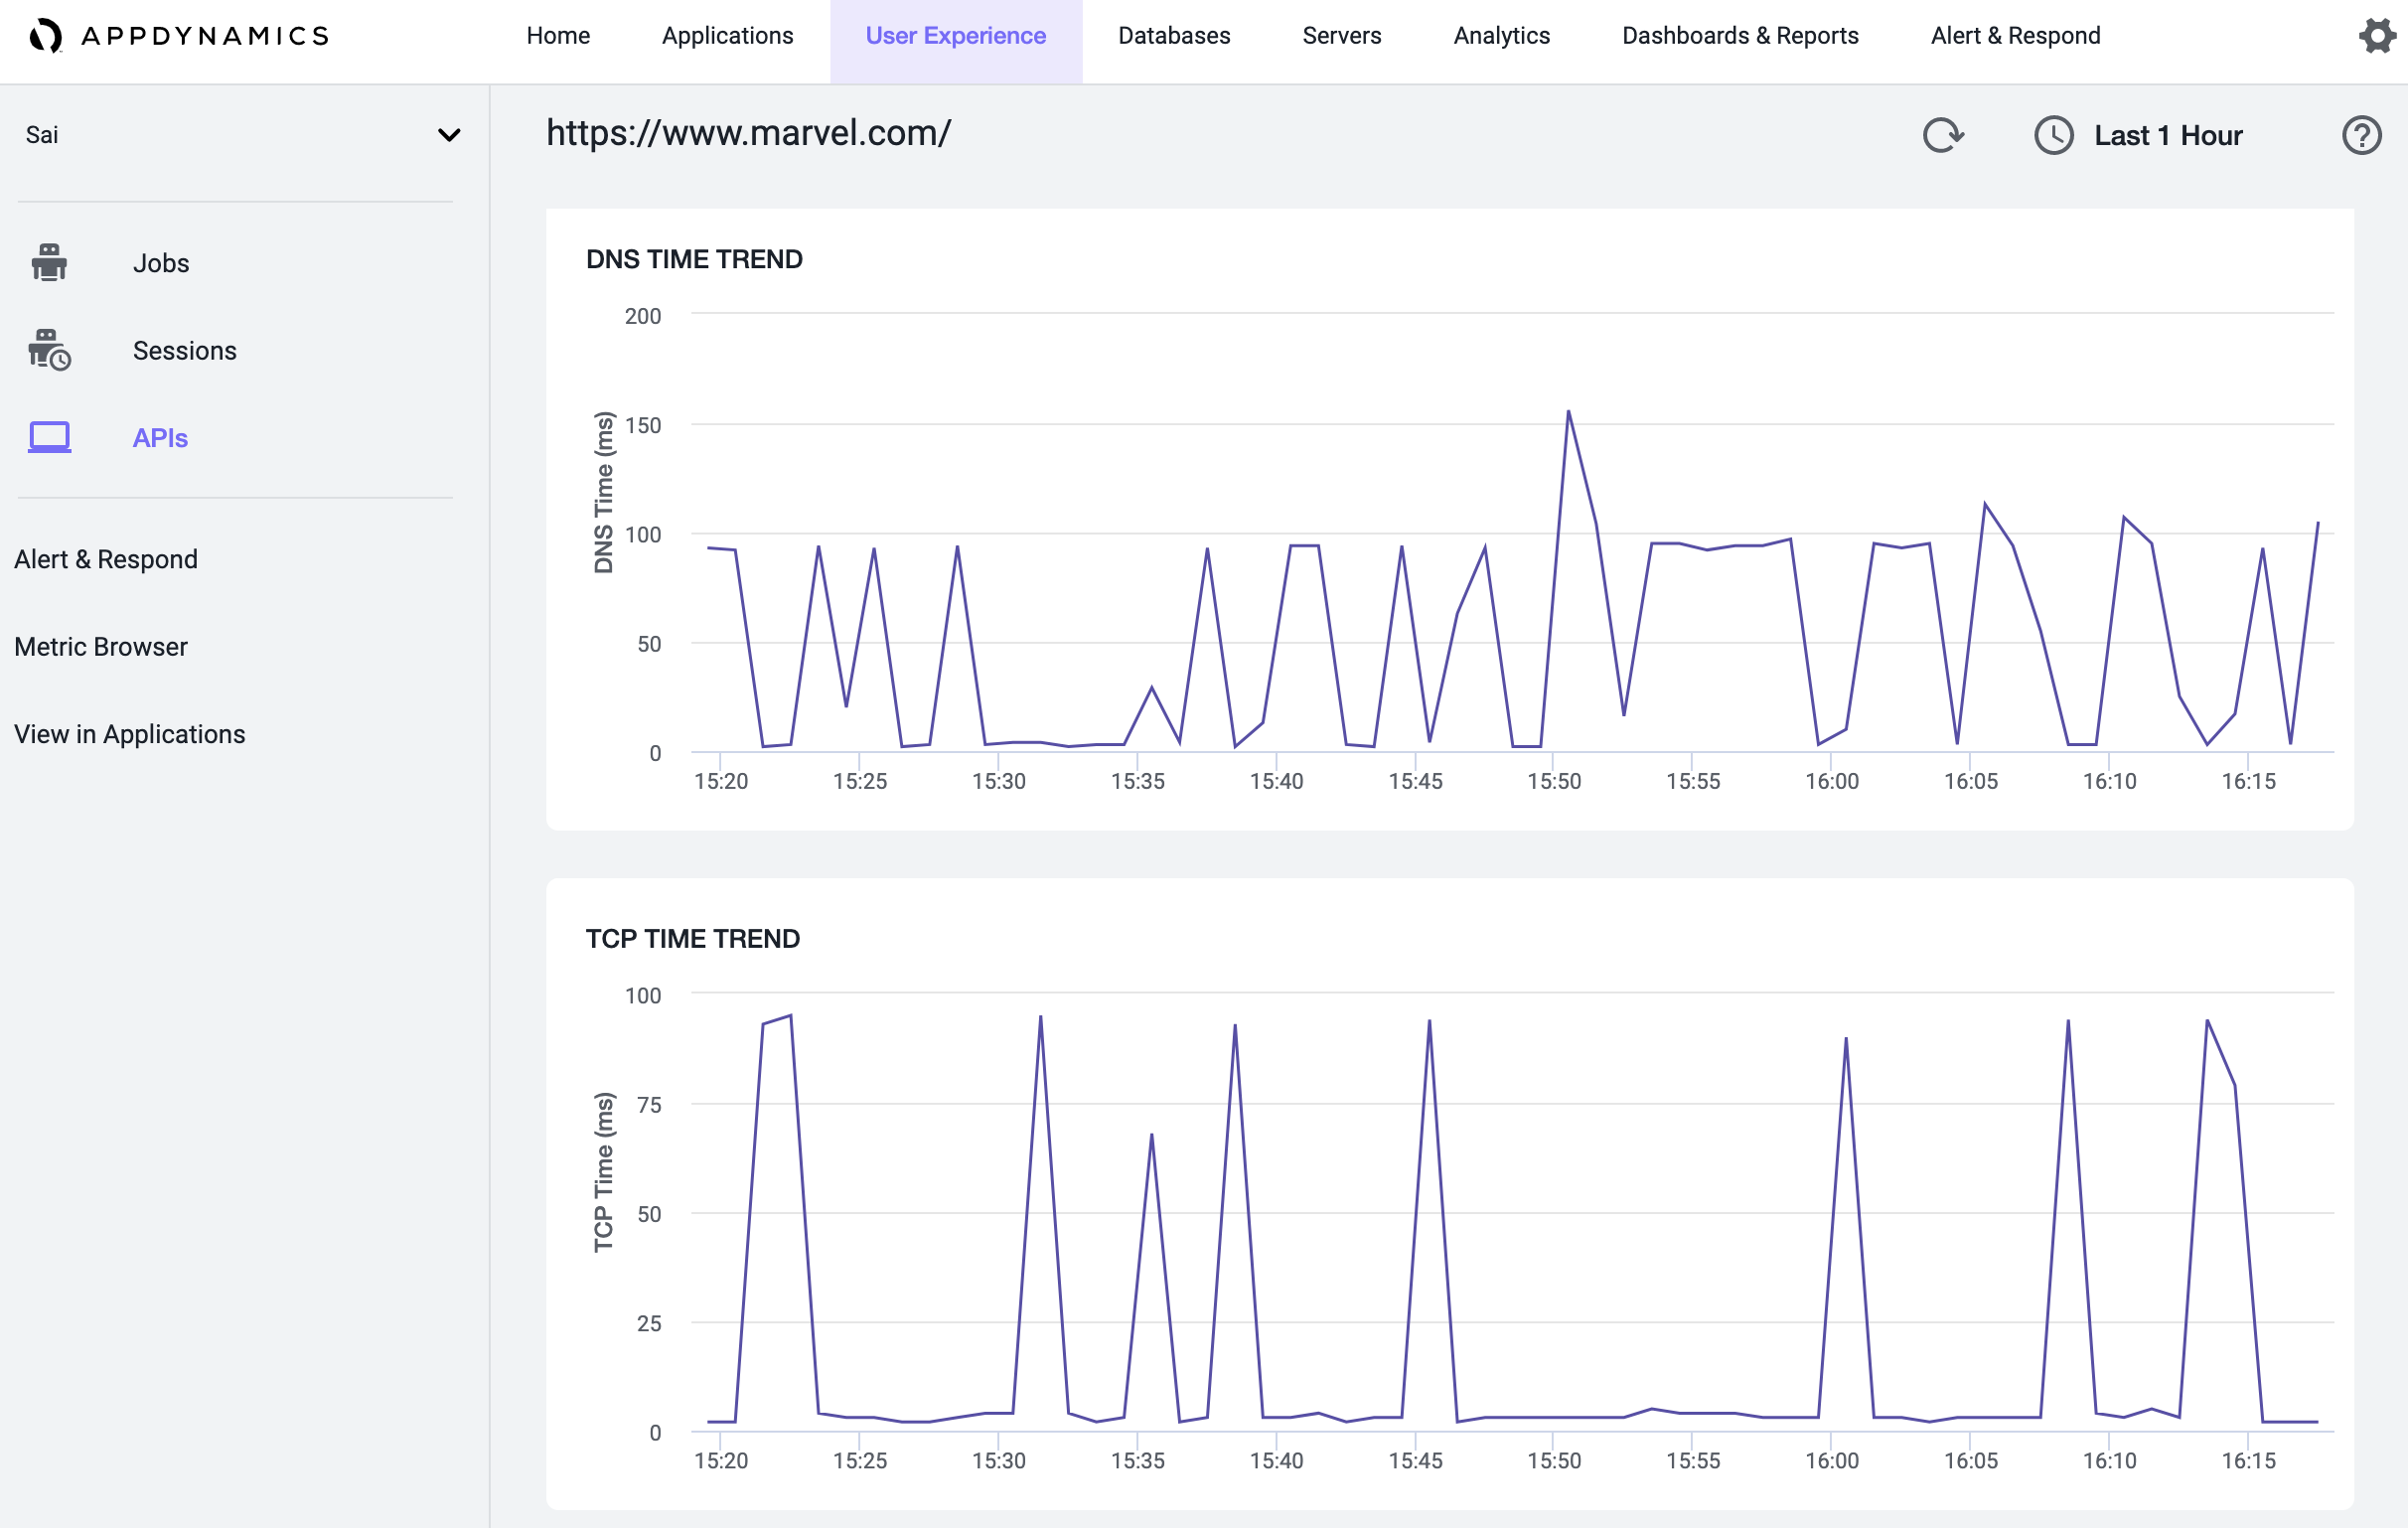
You can select an API and click Details to view the details of that particular API. Alternatively, you can also double-click an API to view the details. The individual API page provides a summary of that API, such as response time and the number of requests.
The page also displays graphs of these parameters:
- HTTP status code trend
- Response time trend
- Response size trend
- Wait time trend
- DNS time trend
- TCP time trend
- TLS time trend


View API Trends Across Jobs in Different Collections
You can click View Options to configure the columns that you want to display or hide.
You can filter the APIs using the Selected Collections option. By default, only the APIs of the parent collection are displayed.
Click Selected Collections and select the API collections of which you want to view the APIs. All the APIs of the selected collections are displayed. When you choose more than one collection, and if an API is common to all the collections, it displays that API's consolidated data.
For example, if https://www.google.com/ is part of two collections, then the displayed data, such as the number of requests, response size, and duration, is the cumulative data of both the collections.