The Database Containers window is available for Oracle Server.
The Containers window displays the names of the Top N containers on the database instance based on time. To see the top N queries run on the container, click a container name and then click View Top Queries. From the Containers top queries page, to see more details about a query you can double-click a query to open the Query Details window.
Access the Database Containers Window
To access the Database Containers window:
To view a database's containers, click the name of the database.
Click the Containers tab.
Database Containers Window Features
From the Database Containers window, you can:
Choose to view information for the top 10, 50, 100 or 200 containers most frequently accessing the database server.
Double click the name of a container to view the top queries for one container in particular, or select the container and click View Top Queries.
Click the down arrow next to the database collector name at the top of the page to choose to view the containers of a different Oracle database collector by either selecting the database collector from the list or by searching for the database collector by entering text in the search bar and then clicking the refresh icon to show only database collectors that meet that search criteria.
Click Actions to export the data on this window in a .csv formatted file that is automatically downloaded to your specified downloads directory.
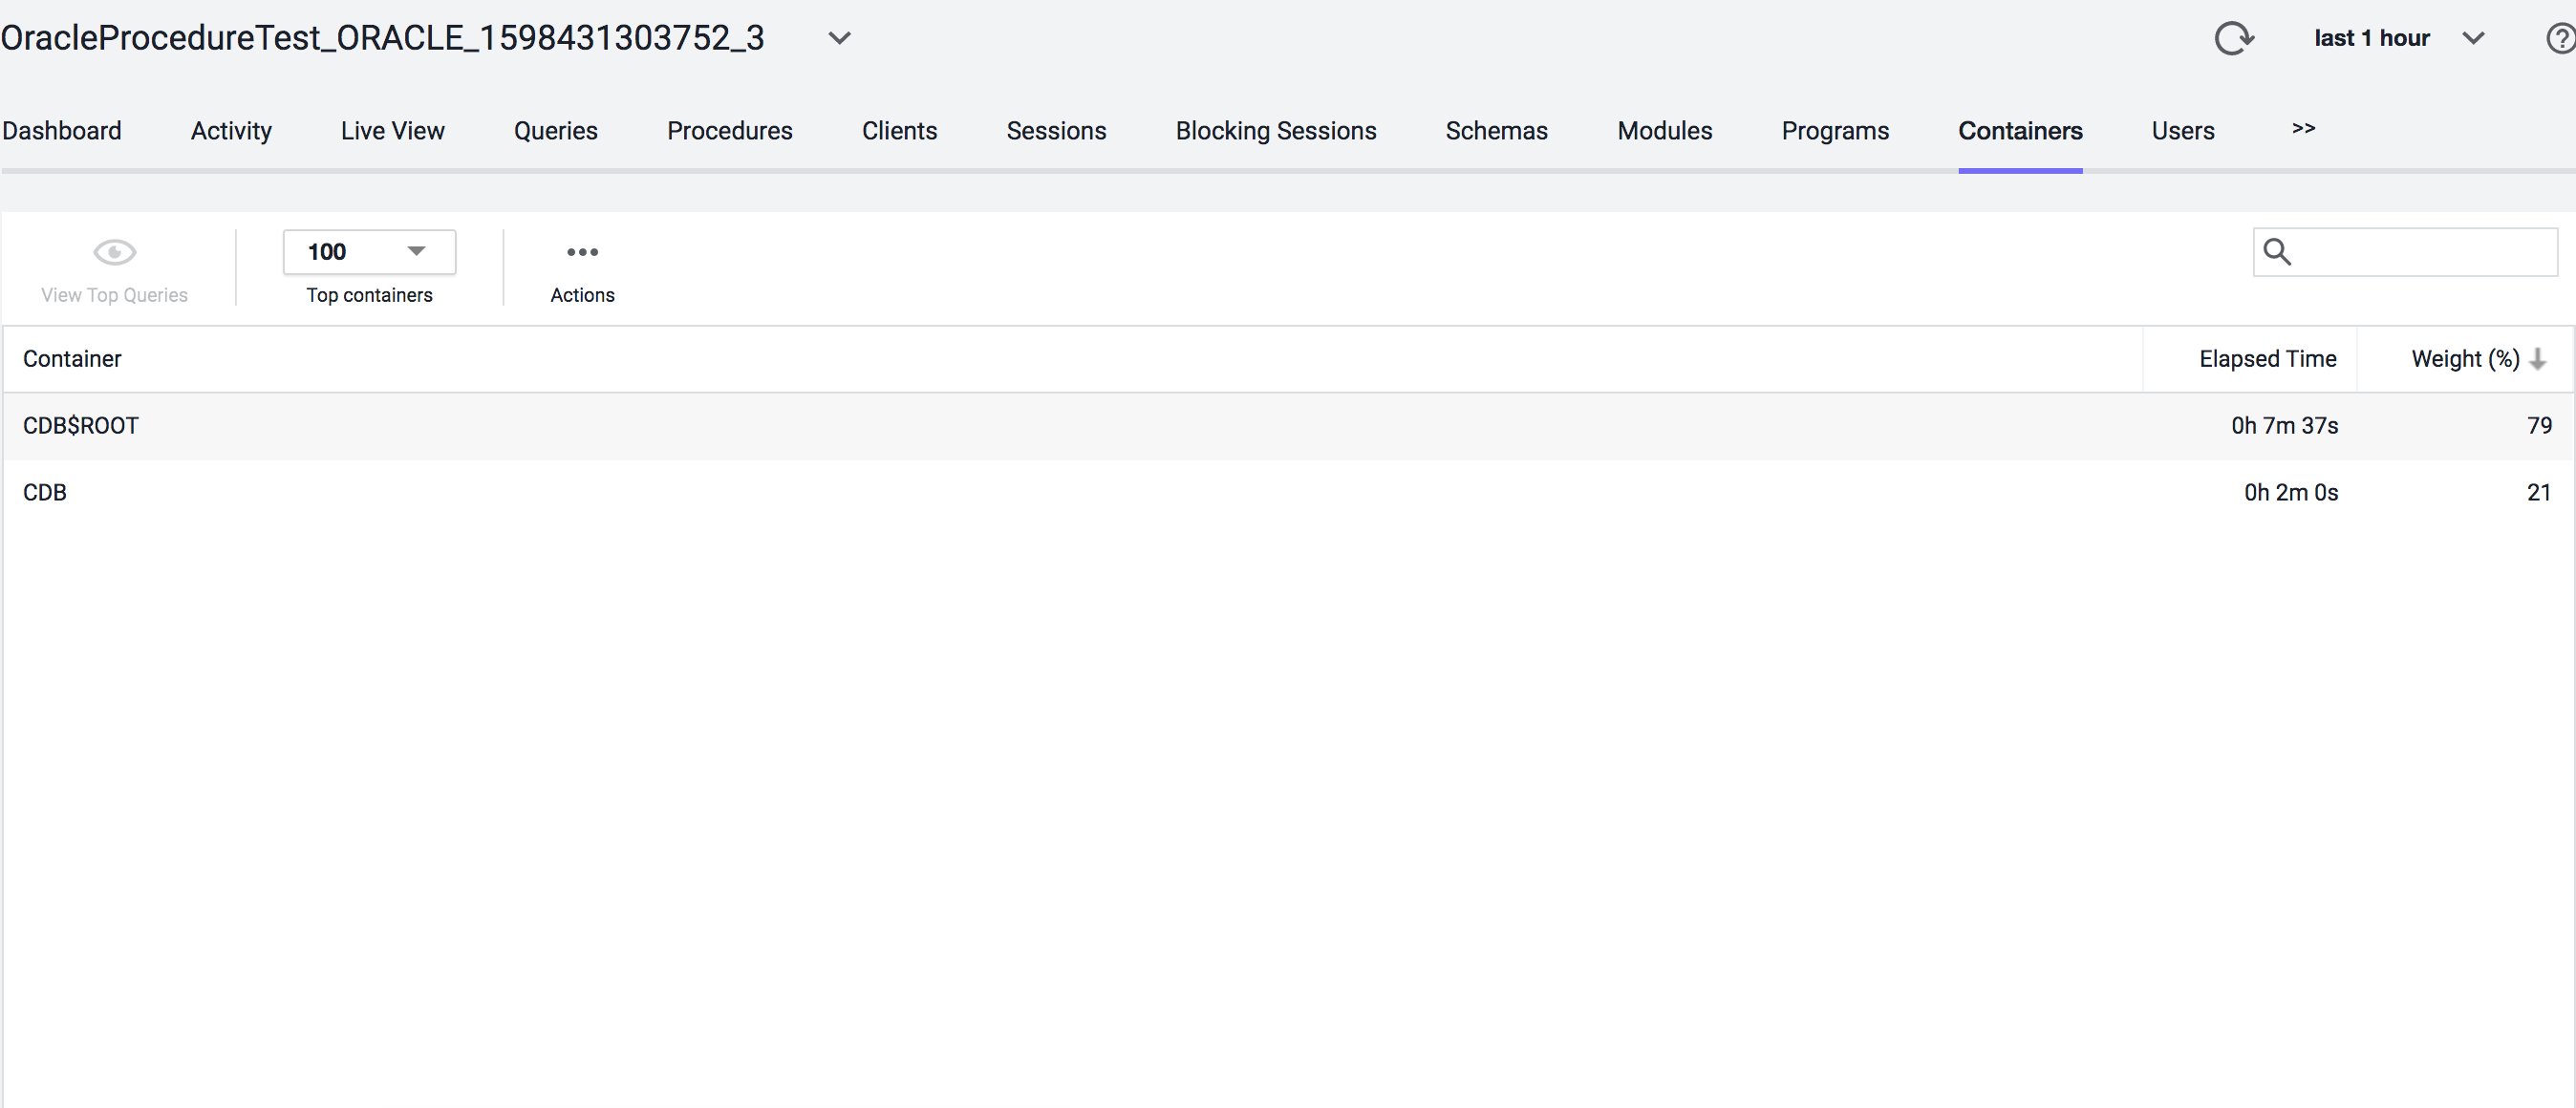
From the Database Containers window, you can view:
Container: The name of the container where queries run in the database.
Elapsed Time: The time taken by the queries to run on the container.
Weight (%): The percentage of time the Container was consuming the database resources in comparison with the usage percentage of other Containers.