By default, AppDynamics retains transaction snapshots that it captures at regular intervals and when a transaction is detected to be performing abnormally. The snapshots may have full, partial, or no call graphs. See Troubleshoot Business Transaction Performance with Transaction Snapshots.
Diagnostic sessions let you trigger a timed session in which AppDynamics captures transaction snapshots for a business transaction at a more frequent interval that you set. In the session, AppDynamics captures full call graphs for the transactions.
Diagnostics sessions can also be triggered automatically by a health rule violation or in response to an abnormal amount of slow or error transactions. By default, if more than 10% of the requests in a minute are slow, AppDynamics starts a diagnostic session.
If the diagnostic session is triggered manually, the diagnostic session collects snapshots on all the nodes that the selected business transaction passes through. If the diagnostic session is triggered to start automatically, the diagnostics session collects snapshots on the triggering node.
Trigger a Diagnostic Session Manually

To start a diagnostic session manually, you need the Start Diagnostic Sessions permission.
You can start a diagnostic session from the business transaction list. In the list, select the transactions and start the session from the
More Actions menu.
To view the transaction snapshots gathered in the session, in the business transaction dashboard, choose Transaction Snapshots > Diagnostic Sessions.
You configure settings that trigger automatic diagnostic sessions from the transaction threshold configuration page. You can configure the threshold settings that trigger a diagnostic session as well as the snapshot collection frequency and duration once the session is triggered.
For performance reasons, you want to limit the duration and frequency of diagnostic sessions to the minimum required time to obtain the maximum amount of information for troubleshooting purposes. To avoid continuous collection when there are ongoing performance problems, configure the wait period between sessions and increase the time as needed.
Use Diagnostic Sessions for Asynchronous Activity
Diagnostic sessions are usually triggered based on the overall performance of a business transaction. However, the overall performance of the business transaction may not reflect the execution time of asynchronous activity. It's possible that the originating transaction executes within normal bounds, while the asynchronous activity takes much longer.
To initiate diagnostic sessions for these scenarios, you can use health rules based on a performance metric (such as response time) of the asynchronous activity. Then, create a policy that triggers a diagnostic session when the health rule violates:
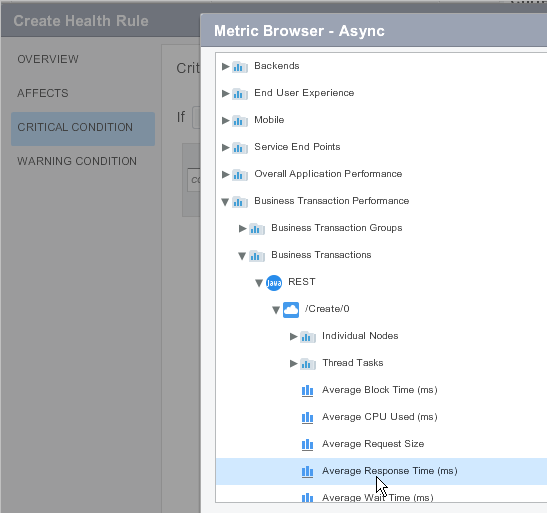
- Create a custom health rule based on the asynchronous metric, such as average response time. The metrics for thread tasks are visible in the metric browser under the Thread Tasks node for transactions with asynchronous activity. Each thread task has an individual node (usually its simple class name). Select Custom as the type for the health rule.
- Create a policy that is based on the baseline of the asynchronous metric of interest, for example, the average response time.
- Configure the policy to trigger a diagnostic session on the affected business transaction. See Business Transactions.