Download PDF
Download page Business Transaction and Log Correlation.
Business Transaction and Log Correlation
When investigating the cause of slowdowns/outages in your business applications, the problem does not always originate in the application code. Any additional information from application or machine logs can be helpful in your DevOps teams' investigation. One way to see supporting data that impacts the business transaction is to analyze logs for that transaction.
By configuring business transactions for GUID Injection, you can correlate logs to specific business transaction requests. This can be helpful when you see slow transactions and the call graph does not give you enough information to get to the root cause. You can use this feature to get the full context related to a failed or slow transaction.
Correlating specific instances of your business transactions to the related logs works by injecting the same requestGUID of the business transaction into the associated logs through our Java Agent. This helps you to quickly find the relevant logs from multiple tiers and nodes for a specific business transaction.

Configuring GUID Injection
This feature supports the following Java logging frameworks:
- Apache log4j versions 1.2.12 to 1.2.17 and 2.6.2 to 2.17.
- logback versions 1.0.0 to 1.2.10. Any version < 1.0.0 is not supported.
To enable transaction to log correlation, use the following steps. You must select the business transactions and specify the logging format.
- Select business transactions for log correlation. This is how you specify to the Java Agent which business transactions you are interested in.
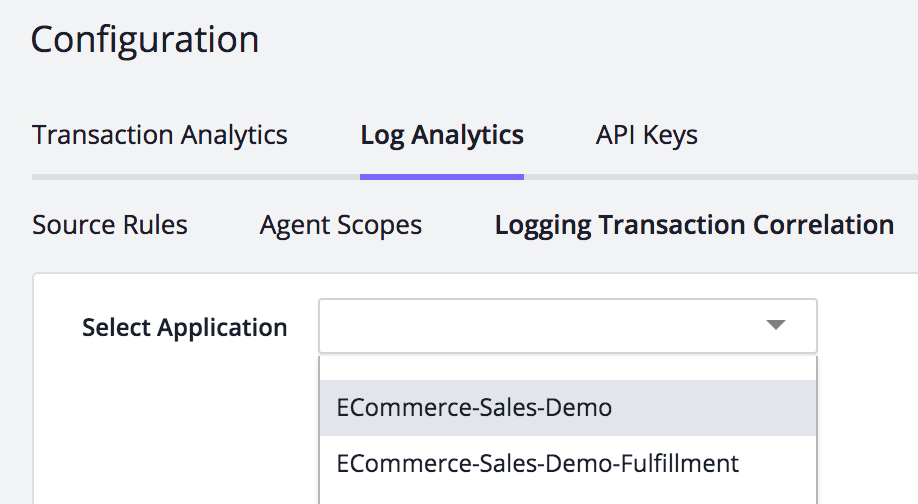
- In the Controller UI, click Analytics > Configuration. Then select Log Analytics > Logging Transaction Correlation.
- Select the application from the dropdown list:
- Scroll down to the section Configure Transactions for GUID Injection:
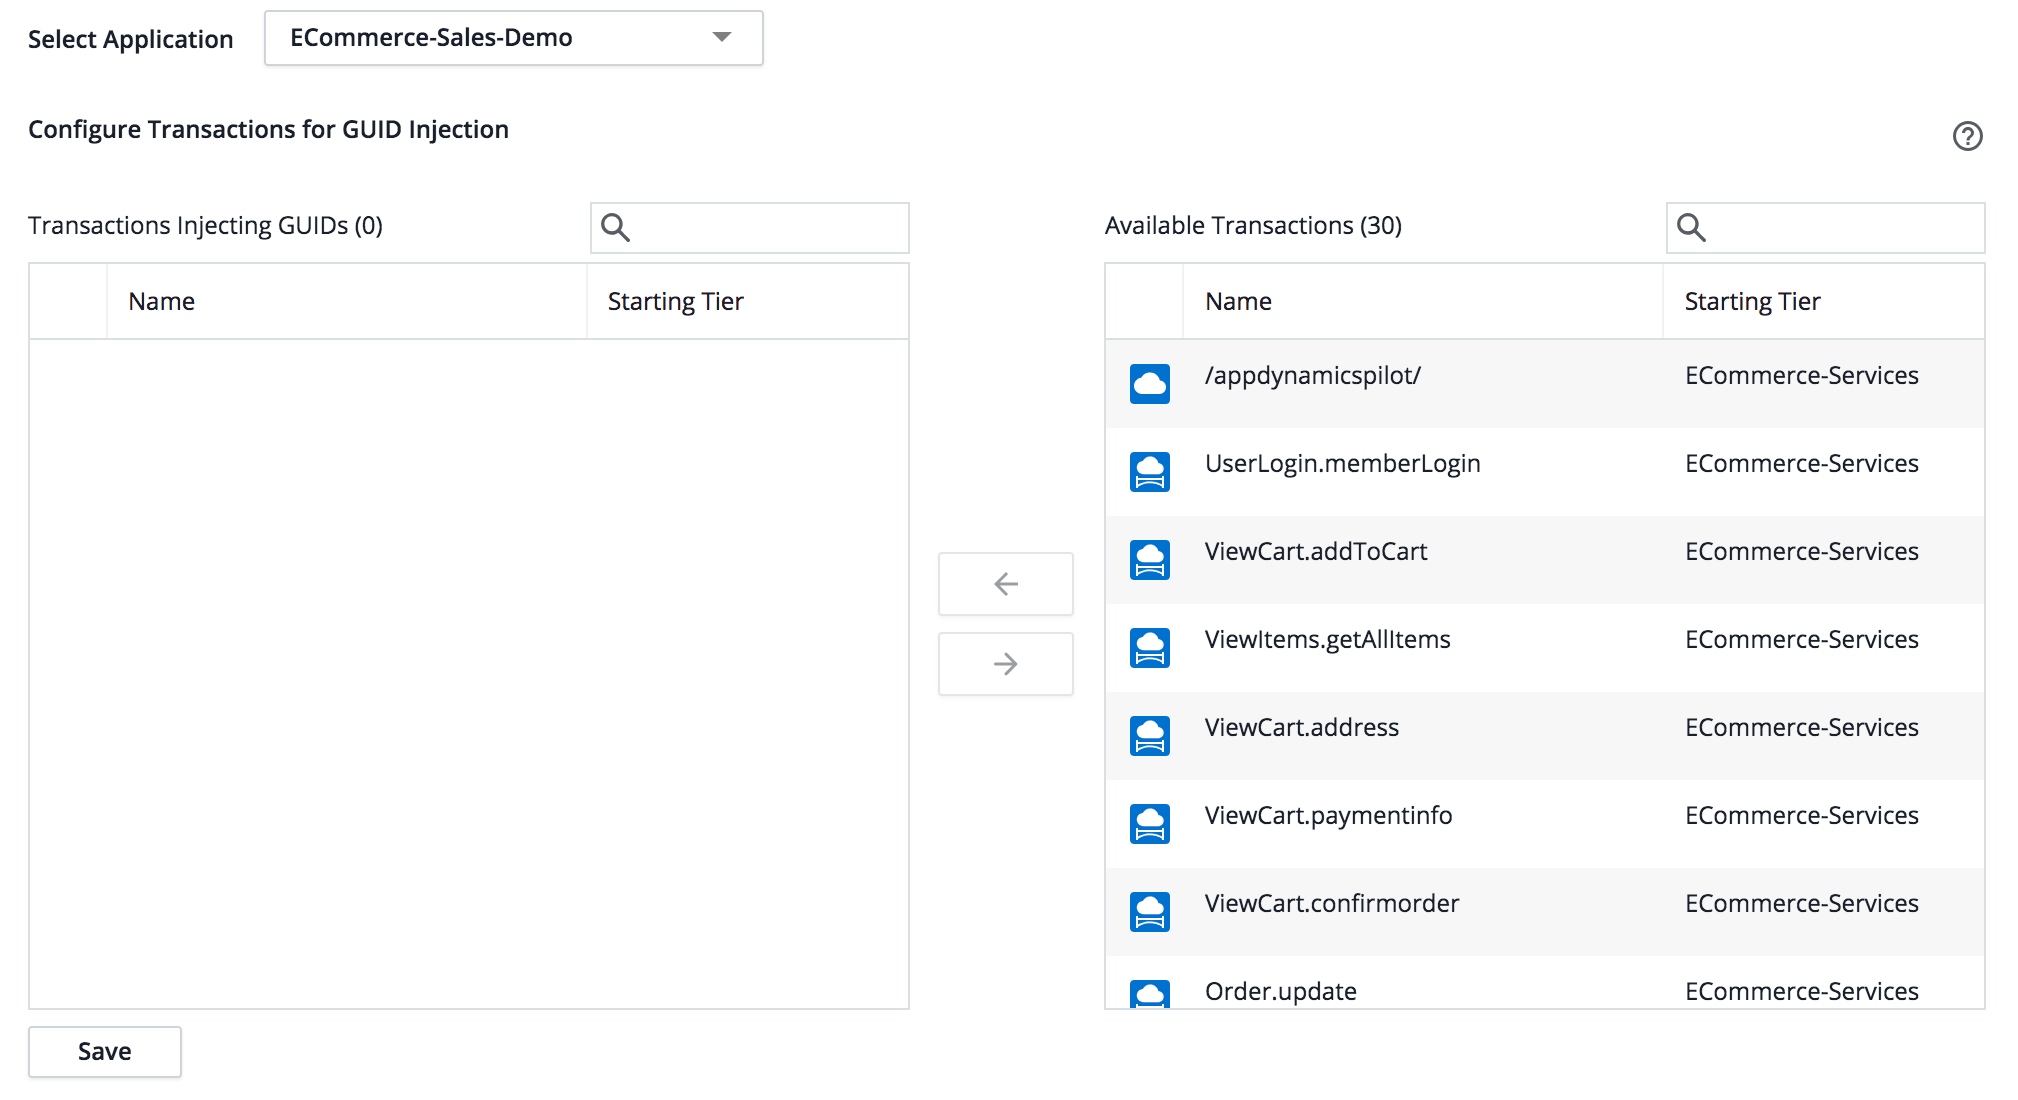
- Add transactions from the right-hand list to the left-hand list and Save.
- Proceed to the next step. You must also configure the logging patterns before you can see correlated logs.
- Define how the injected information appears in the logs. You need to know the appender name and pattern for your application logging framework so you can properly configure this feature. In simple terms, a pattern is responsible for formatting a logging request and an appender takes care of output destination. You can configure this through the Controller UI as described here. You can also add the appender directly to your code. See Add Appender in Your Source Code.
- On the Analytics Configuration window, scroll to the section Configure Patterns for Logging format.
- Select application, tier, or node where you want to collect correlated logs.

- Enter the Appender name and choose the log framework.
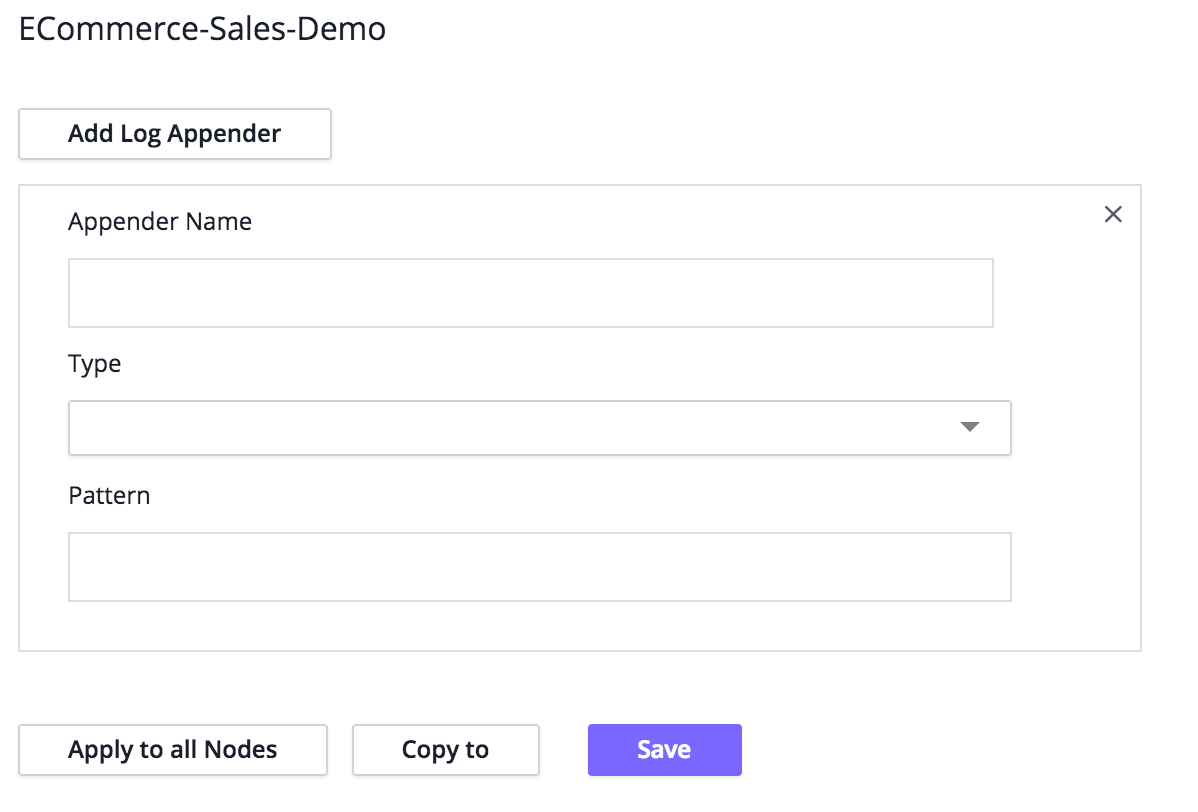
Enter the pattern and the request GUID string. You can add the request GUID anyplace in the pattern. The request GUID must match the following exactly:
[%X{AD.requestGUID}]CODEFor example, the following screenshot shows the standard log4j pattern plus the request GUID:
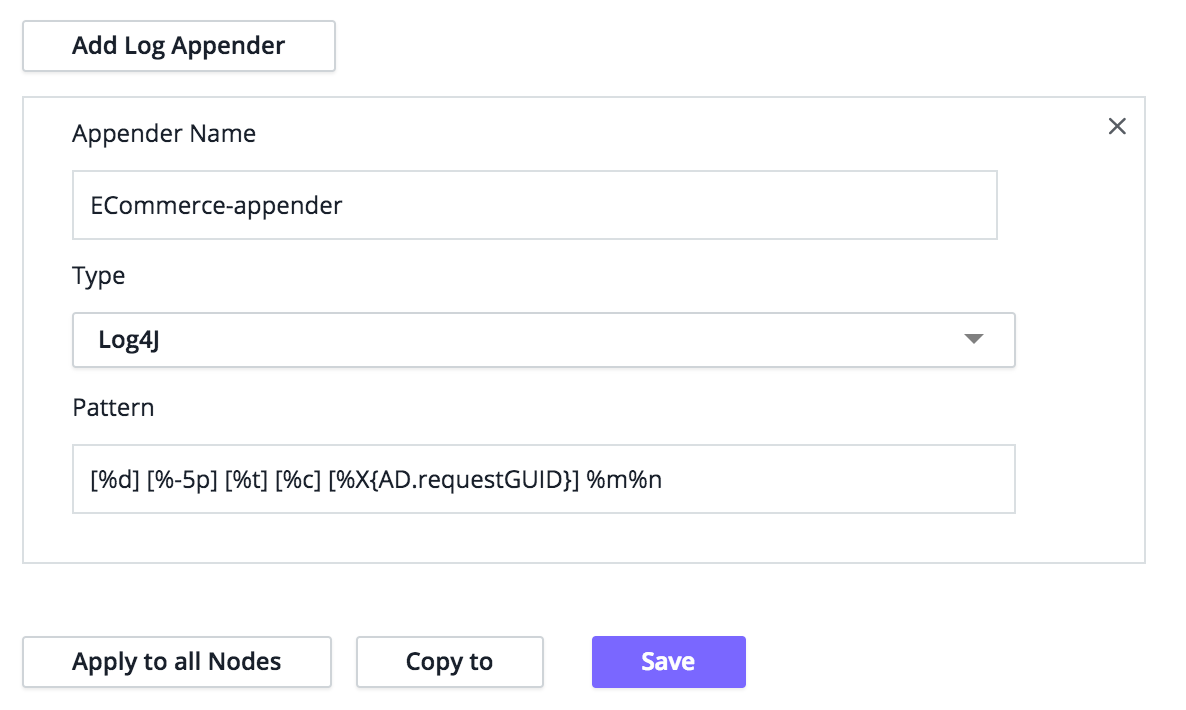
Detail of Log4j example with the request GUID string:[%d] [%-5p] [%t] [%c] [%X{AD.requestGUID}] %m%nCODE
Restart the affected application to enable the logger to pick up the new logging configuration.
Add Appender in Your Source Code
If you have access to the source code for your application, you can also add the appender to the log4j.properties file directly. Here is an example of what that might look like with the request GUID in BOLD:
log4j.appender.order-file-appender=org.apache.log4j.FileAppender
log4j.appender.order-file-appender.File=logs/telecom-order.log
log4j.appender.order-file-appender.layout=org.apache.log4j.PatternLayout
log4j.appender.order-file-appender.layout.ConversionPattern=[%d] [%-5p] [%t] [%c] [%X{AD.requestGUID}] %m%n
log4j.logger.com.appdynamics.order=DEBUG, order-file-appender
log4j.additivity.com.appdynamics.order=false
Extracting Request GUID From the Source Rule Configuration
To enable searching logs by request GUID and to view correlated logs and transaction data, use the following steps:
- In the Controller UI, click Analytics > Configuration > Log Analytics > Source Rule.
- Extract the request GUID field in the log source rule configuration. See Field Extraction for Source Rules.
- If Manual Field Extraction is selected, the following regular expression can be used to configure request GUID:
AD_REQUEST_GUID\[(?<requestGUID>.*)\]\].
- If Manual Field Extraction is selected, the following regular expression can be used to configure request GUID:
Viewing Correlated Logs and Transaction Data
Once you have configured GUID injection, you can search the log files from a number of points in the Controller. Correlation only works when there are logs with the associated GUID in the given time range for an application where this feature is configured. The Search Logs By Request GUID button appears when there are logs for the snapshot request GUID in the snapshot time range.
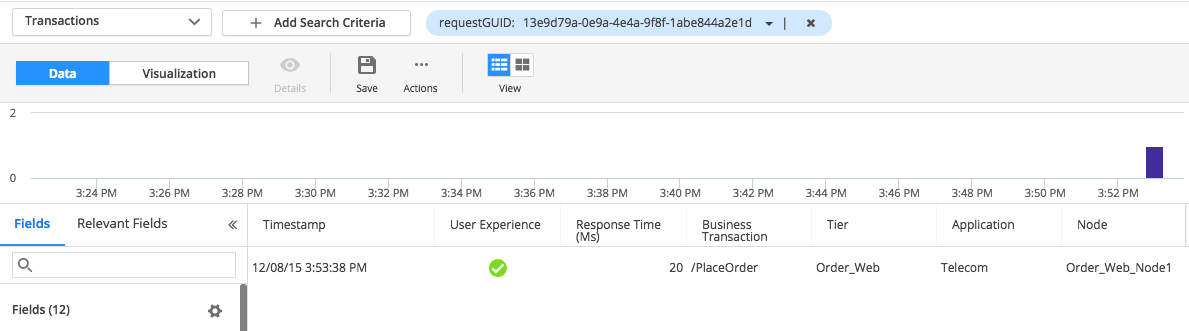
APM to Analytics: From a business transaction snapshot
- Locate a slow transaction or other transaction that you want to troubleshoot.
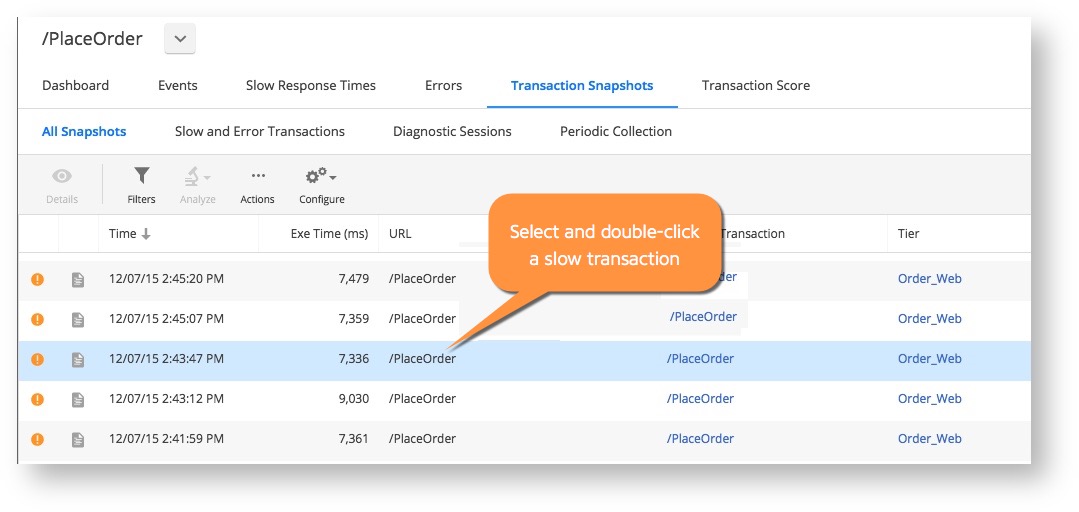
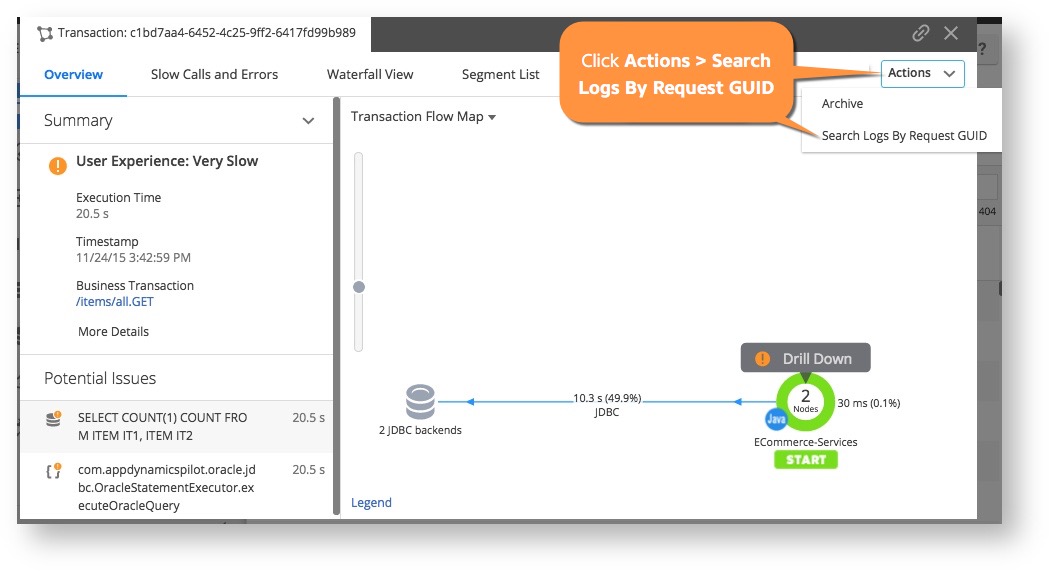
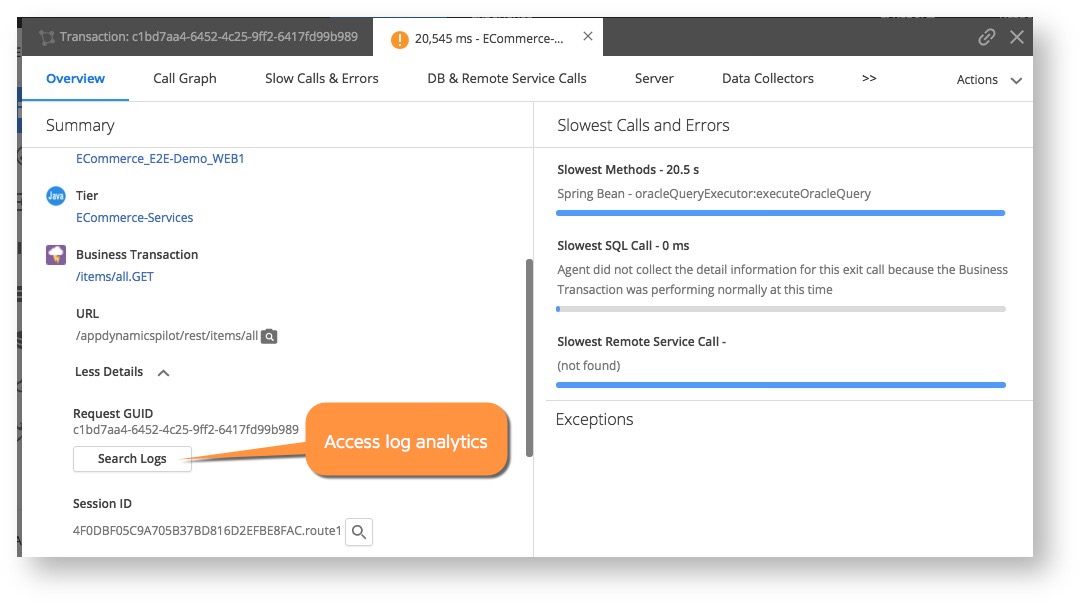
- Click More Details > Search Logs or use Actions > Search Logs By Request GUID.
From the log details in this example, you can see that the reason this transaction was slow is that the order processing queue was full and it took many retries before the order could complete.

Transaction Analytics to Log Analytics
You can select relevant transactions from any transaction analytics search and see details.
- Select the transaction, then double-click or click Details in the Action toolbar.

- On the Overview tab, you have two ways to search the logs by request GUID.

- When you search the logs, you see the correlated logs in the Log Analytics window.

From Log Analytics to Transaction Analytics
You can select a log from any log analytics search and see the Event Details.
- Select the log, then double-click or click Details in the Action toolbar. You can see the Event Details window.
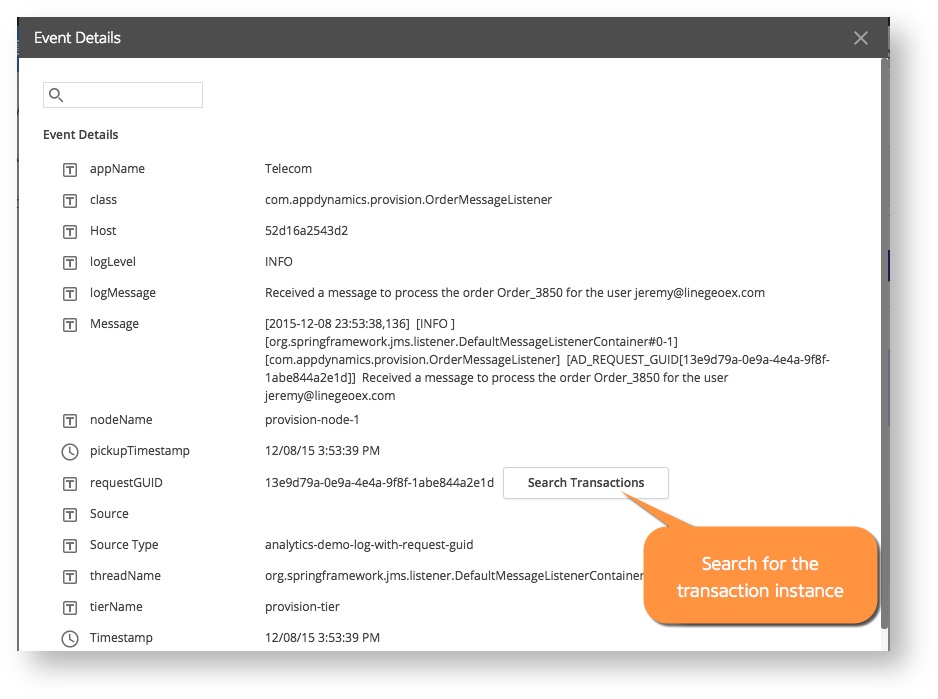
- Use the Search Transactions button to find the relevant business transaction in transaction analytics data.