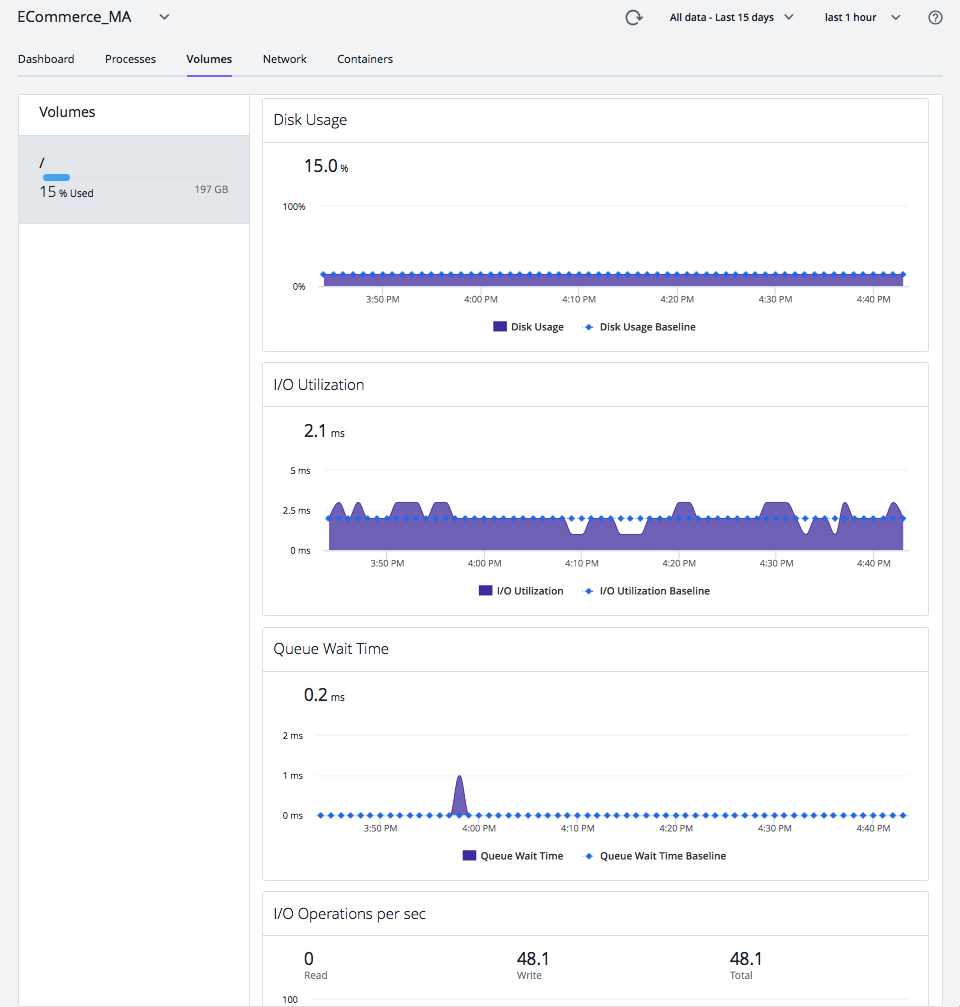
AppDynamics APM Platform 22.x Infrastructure Visibility Server Visibility Monitor Your Servers Using Server Visibility Current: Server Volumes Metrics PDF Download PDF Download page Server Volumes Metrics. Current page All pages Server Volumes Metrics To access Server Volumes Metrics, select AppDynamics Home > Servers > double-click server > Volumes.From the Server Volumes tab, you can: View the list of volumes, the percentage used, and total storage space available on the disk, partition, or volumeView disk usage and I/O utilization, rate, operations per second, and wait timeChange the time period of the metrics collected and displayedClick on any point on a chart to review the metric value for that time The Machine Agent does not monitor Linux remote volumes. Metrics in the Server Volumes TabFor each selected disk, partition or volume, these columns are available for the Server Volumes panel. Disk Usage %: The percentage of storage space in use (To configure how this metric is calculated on Linux, see Configure Disk Usage Metric Collection on Linux).I/O Utilization %: The percentage of time spent performing read and write operationsI/O Rate read: The number of kilobytes per second of data readsI/O Rate write: The number of kilobytes per second of data writesI/O Operations per sec read: The number of read operations per secondI/O Operations per sec write: The number of write operations per secondI/O Wait Time read: The percentage of time the CPU was waiting for read operations to completeI/O Wait Time write: The percentage of time the CPU was waiting for write operations to complete Volume space metrics on POSIX systems are obtained using the "df" command. On Linux, the space reserved for root is not counted in the available space. ×