To view the application dashboard of a specific application, click the application on the Home page. On the application dashboard, you can view the following:
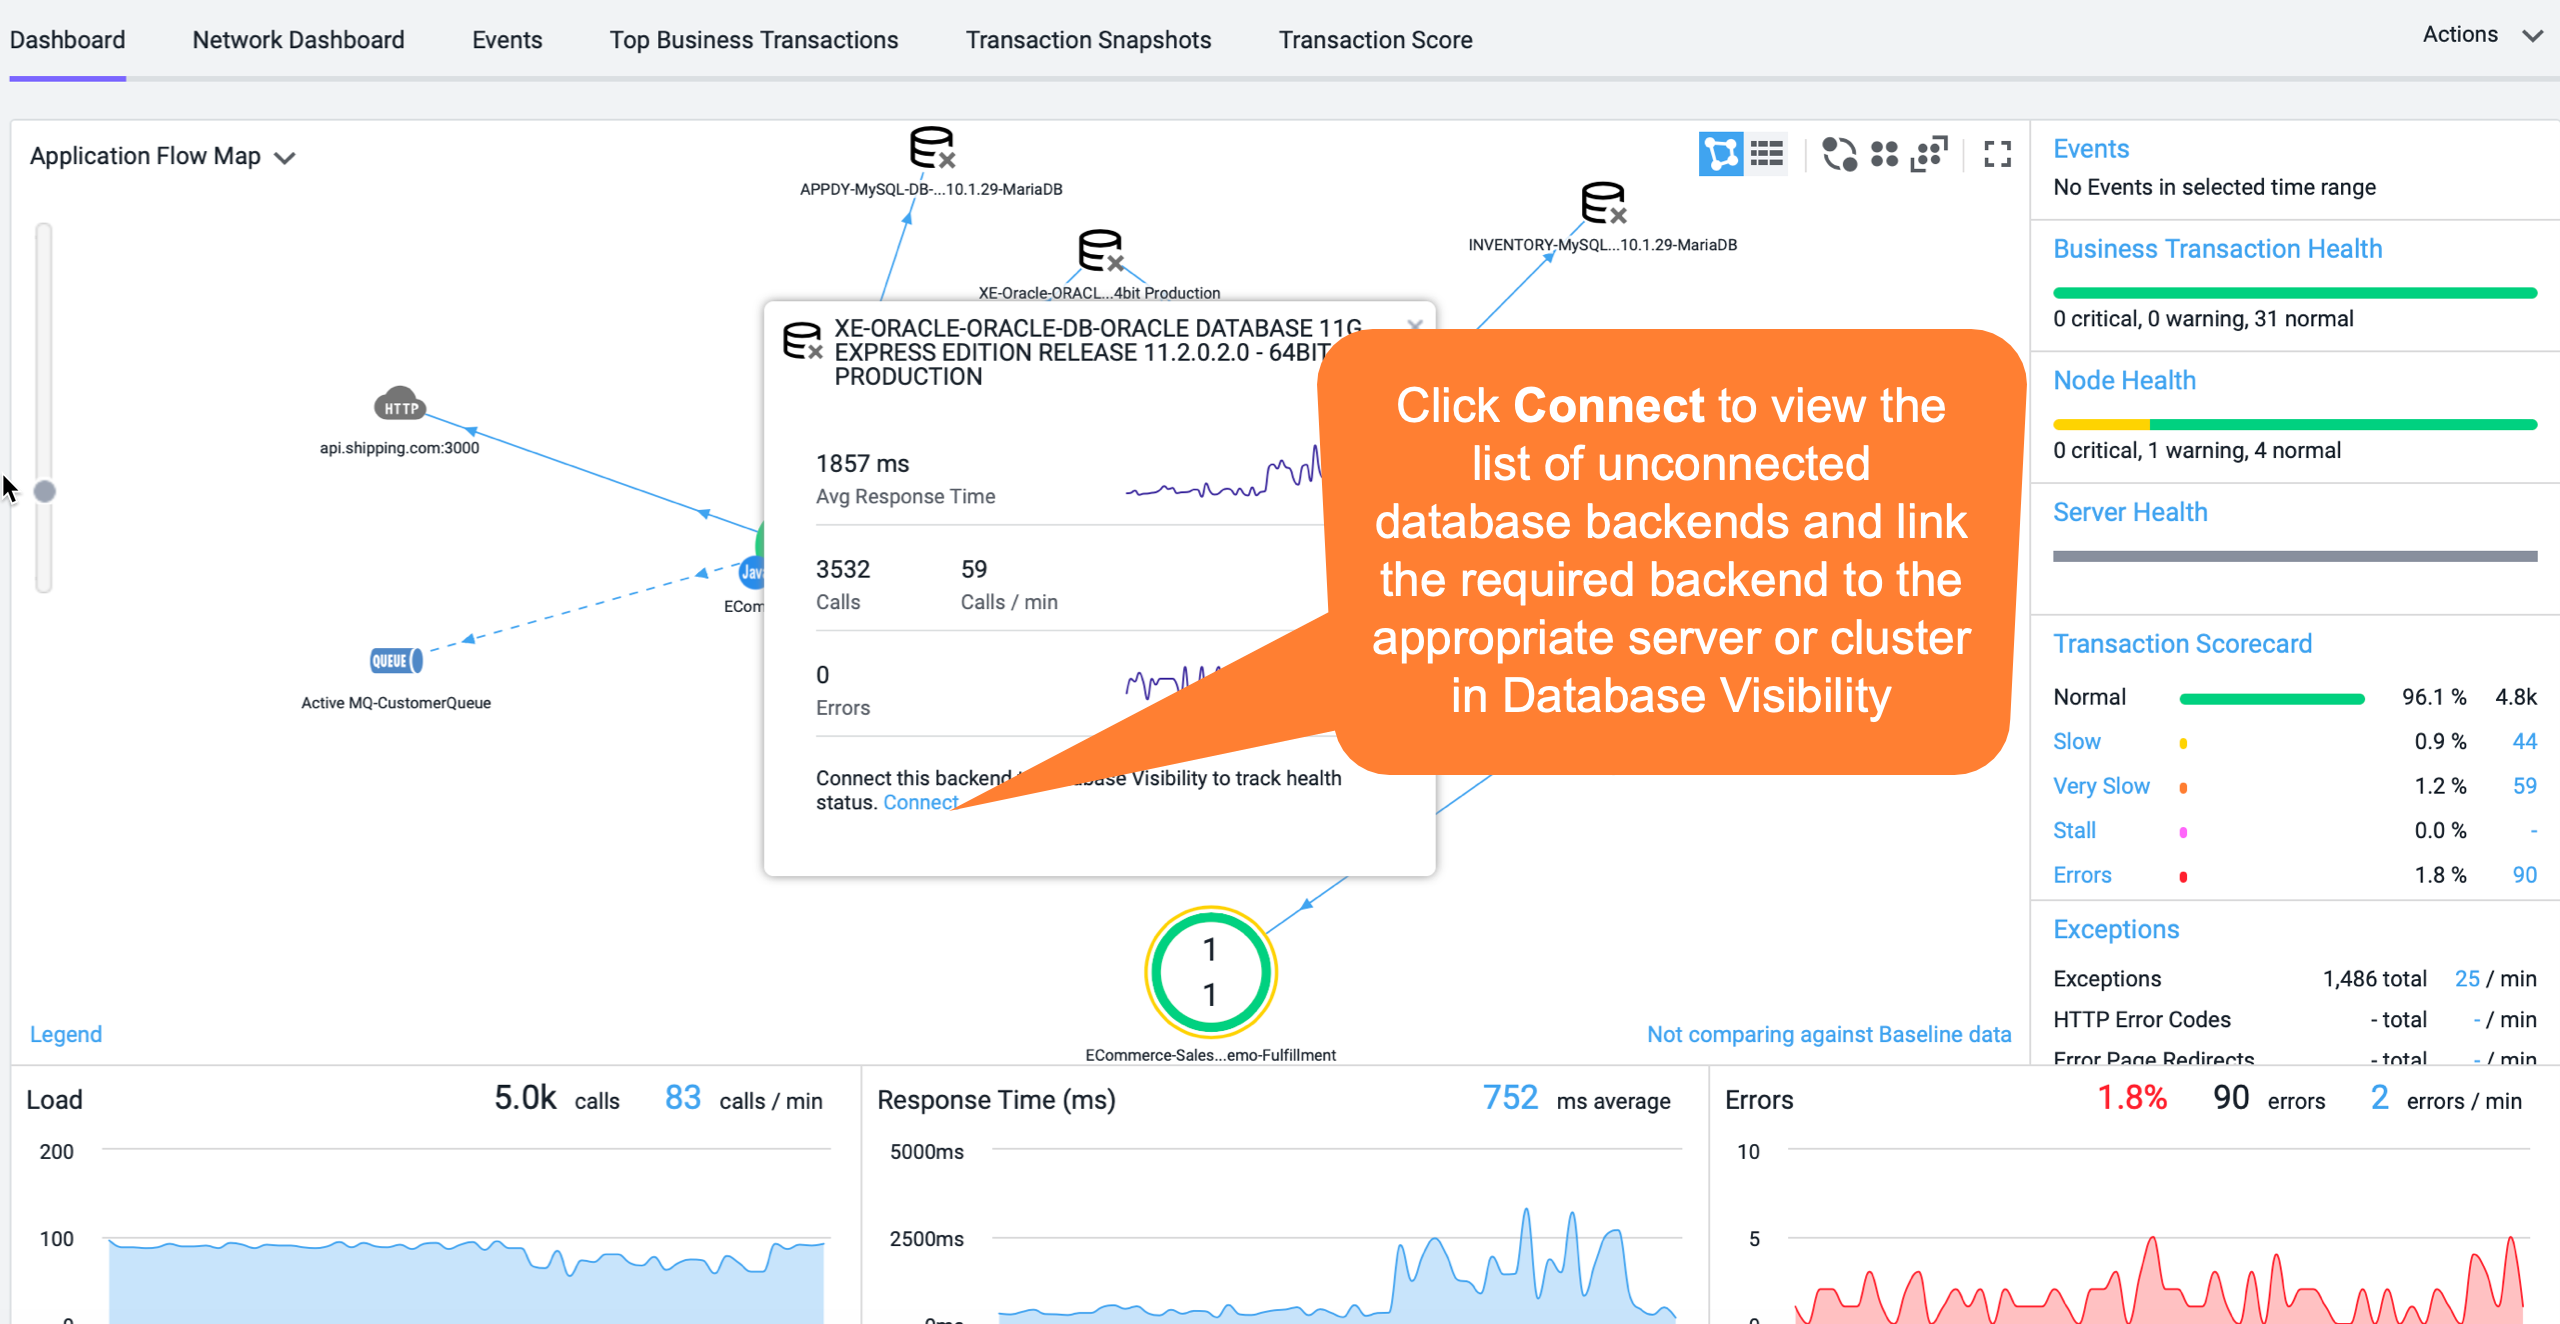
Unconnected Backends: If there are any unconnected backend database servers, the flowmap displays the unconnected database server icon. You can click the icon, then click Connect to connect the backend database to the appropriate server or cluster in Database Visibility.
Status of the Database: There are different icons to display different states of the database based on the health rule violation. For information about the different icons, see Database Icons.
Quick View of Database Visibility: If you require to view some of the main metrics without going to the Database Visibility UI, you can click the database icon and the quick view of the metrics is displayed. For detailed information, click View in Database Visibility.
View Database Activity in Database Visibility
Once you have configured a database Collector in AppDynamics Monitoring, you can access Database Visibility either from the AppDynamics Home page or you can link to the Database Visibility database instance Dashboard by right-clicking the database and selecting View in Database Visibility on the Application Flow Map, Tier Flow Map or Node Flow Map.
Database backends with the same hostname, port number, and database type as a database server already configured in a database Collector are automatically matched with the Collector, and drilldowns from the Application Flow Map, Tier Flow Map or Node Flow Map to Database Visibility are enabled.
The AppDynamics Database Visibility section in the Application Database Dashboard displays which database Collector is associated with the database. If you require to change this association, right-click the database and then click Edit Connection to Database Visibility and choose the appropriate server or cluster that is configured in Database Visibility.
View Business Transaction Snapshot Correlated Database Details
Available for Java, .NET, and PHP applications and their relational database backends, snapshot correlation shows the details of queries executed by the business transaction. It also shows the clients, sessions, and schemas in which those queries were executed.
View Database Details
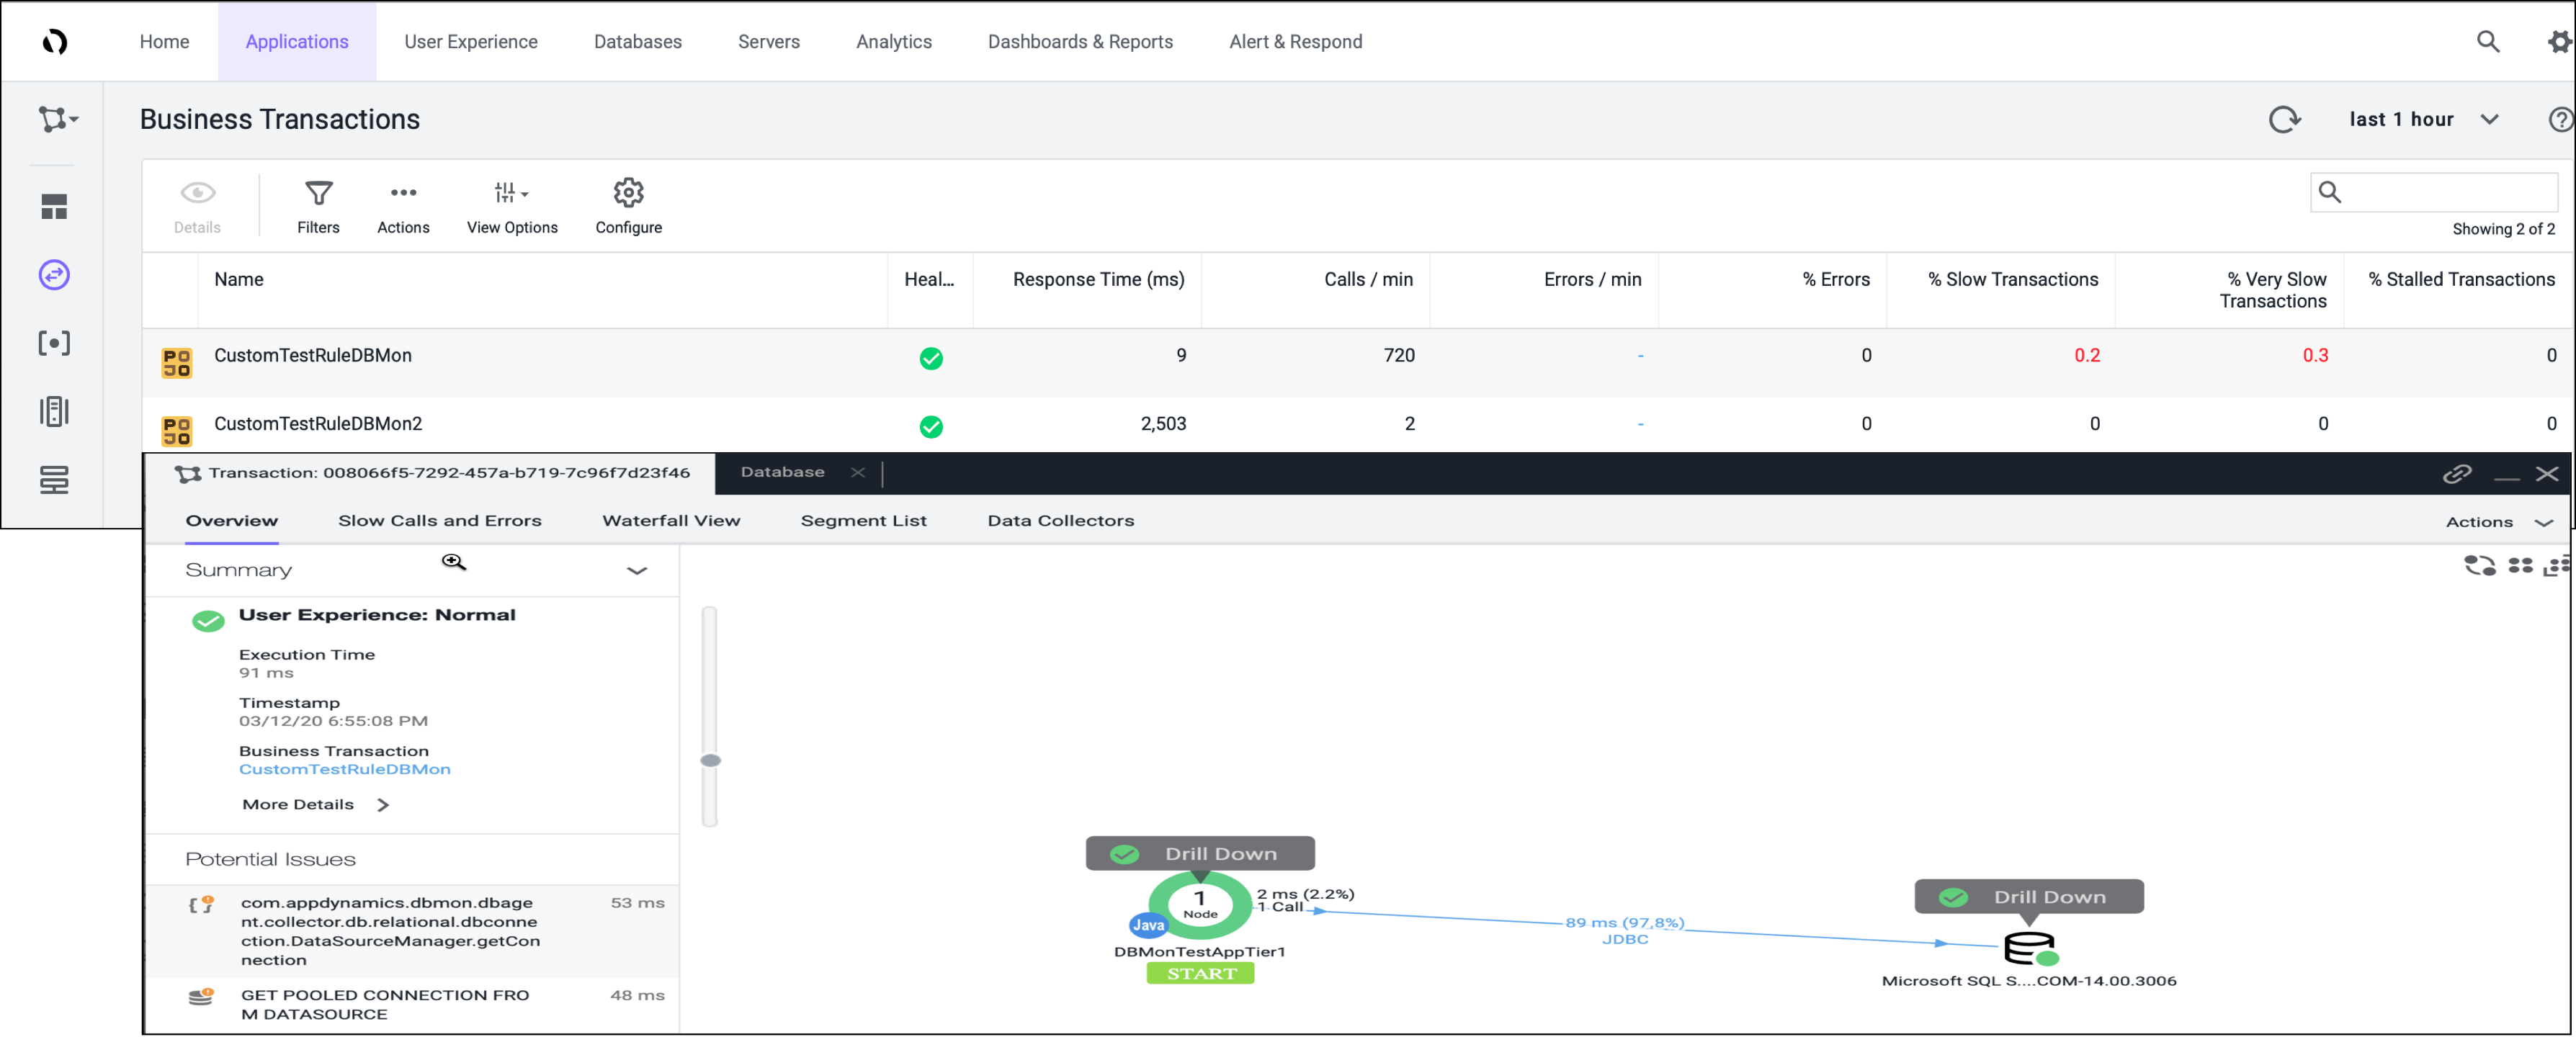
On the Business Transactions page, double click any business transaction to view the queries that are executed in that transaction.
Click the DB Queries tab. On this tab, you can view the queries that were issued by this business transaction.
View Correlated Database Details
From a list of business transactions with snapshots, choose a long-running business transaction that accesses the database, one that takes a few seconds or more. These are more likely to have captured database details.
Double-click Drill Down above the database icon. The correlated database details window appears.
Click the Queries, Clients, Sessions, and Schema tabs to view details of database activity that occurred around the time when the snapshot was captured. For relational databases, these details reflect the database activity from the transaction snapshot. For non-relational databases, these details reflect the database activity that occurred around the time of the transaction snapshot.
For Oracle backends only: If you want to list only the queries executed by the Transaction Snapshot in the Transaction Snapshot window, you can enable the jdbc-dbcam-integration-enabled node property for the Java Agent.