Download PDF
Download page Errors and Exceptions.
Errors and Exceptions
AppDynamics Application Intelligence Platform captures and presents information on business transaction errors in the monitored environment.
At a high-level, a business transaction is considered to have an error if its normal processing has been affected by a code-level exception or error event, including custom error events based on methods you specify.
View Error and Exception Information
The Controller UI presents information on errors and exceptions in various places in the UI, including in transaction snapshots, metrics, and dashboards.
The informational popups for tiers in flow maps have an error tab that displays error rate metrics for the tier:

On the application and tier flow maps, the error rate is for all business transactions. On the business transaction flow map, errors apply only to the current business transaction.
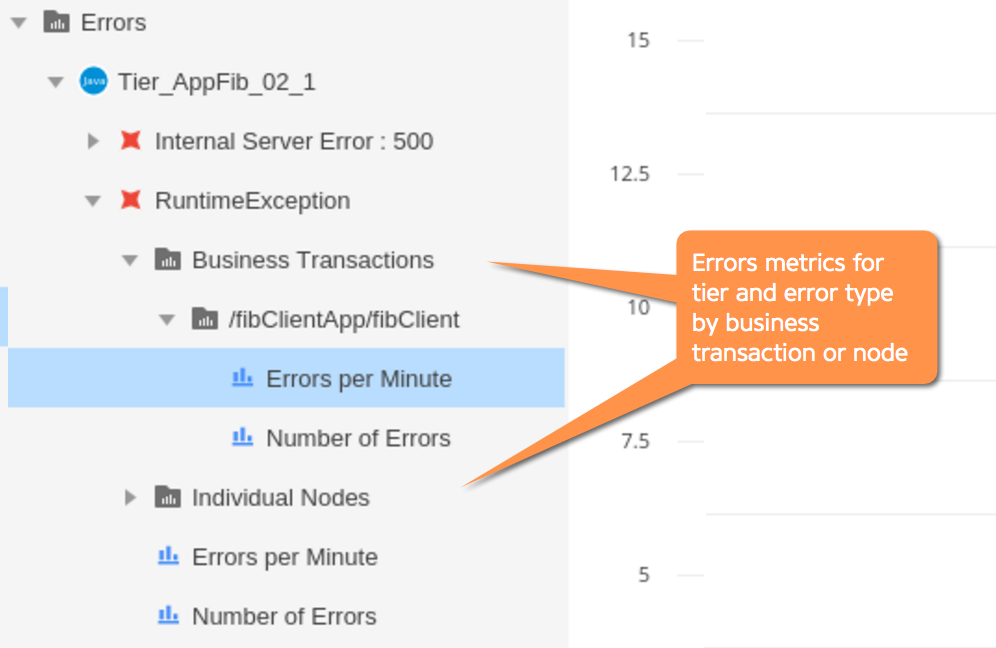
The Metric Browser includes Error metrics:
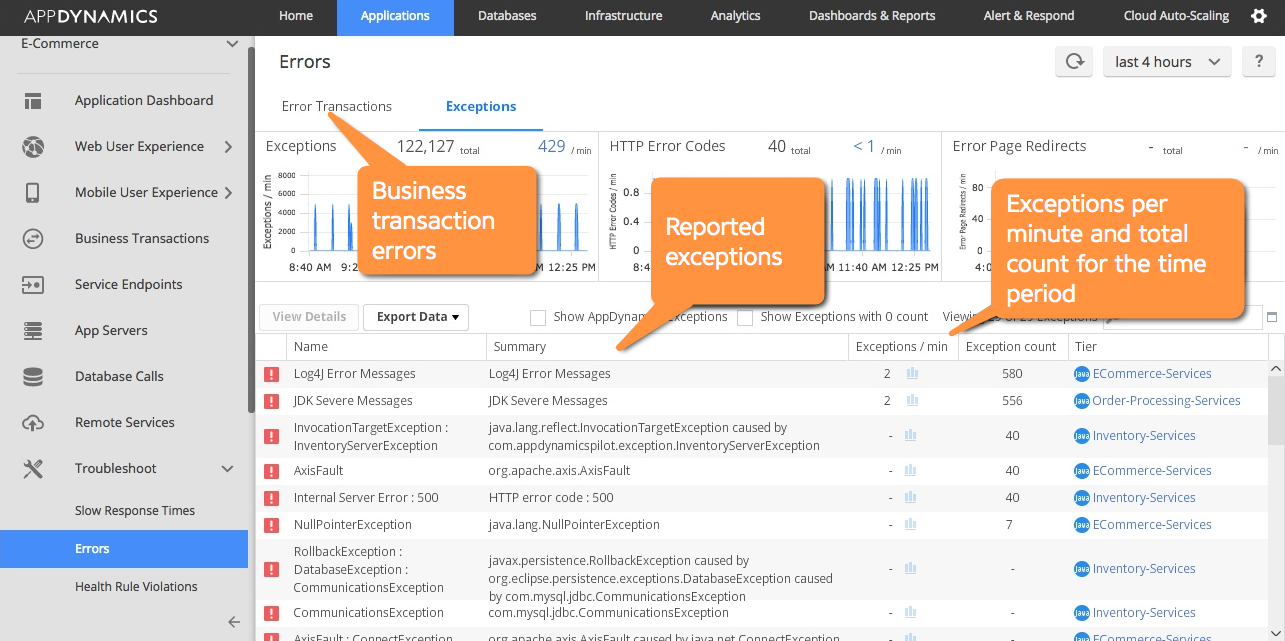
The Troubleshoot > Errors page shows all error transactions. The page contains two tabs, one for transaction errors and one for Exceptions.
The tabs show information on the rate of errors or exceptions, and lets you drill down to the error or exception for more information, as shown:
Business Transaction Error
All transaction errors that have been detected according to the configured error detection rules in the selected time frame of the Controller UI appear in the Error Transactions tabs of the Errors page.
By default, AppDynamics considers a business transaction to be in error if it detects one of the following types of events in the context of the transaction:
- An unhandled exception or error. An exception that is thrown and never caught or caught after the business transaction terminates results in a transaction error, and the exception is presented in AppDynamics. An exception that is thrown and caught within the context of the business transaction is not considered a transaction error and the exception is not captured in AppDynamics.
- An exception caught in an exit call, such as a web service or database call.
- An HTTP error response, such as a status code 404 or 500 response.
A custom-configured error method and error message.
Error detection configuration is described in Error Detection.
Errors that occur on a downstream tier that are not propagated to the originating tier do not result in a business transaction error. If the originating client receives a 200 success response, for example, the business transaction is not considered an error. The error contained within the downstream tier does count against the Error Per Minute metric for the continuing segment.
When a business transaction experiences an error, it is counted only as an error transaction. It is not also counted as a slow, very slow or stalled transaction, even if the transaction was also slow or stalled.
Code Exceptions in AppDynamics
Code exceptions are a common cause of business transaction errors. The Exceptions tab in the Errors page shows an aggregated view of the exceptions across all transactions. For purposes of this view, AppDynamics considers the following types of incidents to be exceptions:
- Any exception logged with a severity of Error or Fatal (using Log4j, java.util.logging, Log4Net/NLog, or another supported logger). This applies even if the exception occurs outside the context of a business transaction, in which case the exception type is specified as Application Server.
- HTTP errors that do not occur in the context of a Business Transaction.
- Error page redirects.
Exceptions that are thrown and handled within a business transaction are not captured by AppDynamics and do not appear in the Exceptions tab.
When troubleshooting errors, notice that the number of business transaction errors does not necessarily correspond to the number of exceptions in a given time frame. A single transaction that counts as an error transaction can correspond to multiple exceptions. For example, as the transaction traverses tiers, it can generate an exception on each one. Troubleshooting an error typically involves finding the exception closest to the originating point of the error.
If a stack trace for the exception is available, you can access it from the Exception tab in the Controller UI. A stack trace is available for a given exception if the exception was passed in the log call. For example, a logging call in the form of logger.log(Level.ERROR, String msg, Throwable e) would include a stack trace, whereas a call in the form of logger.log(Level.ERROR, String msg) would not.
Agent Errors
Error and Exception Limits
AppDynamics limits the number of registered error types (based on error-logging events, exception chains, and so on) to 4000. It maintains statistics only for registered error types.
Reaching the limit generates the CONTROLLER_ERROR_ADD_REG_LIMIT_REACHED event. While it is possible to increase the limit, we recommend refining the default error detection rules to reduce the number of error registrations to have the error you are not interested in capturing ignored.
For more information, see information on configuring log errors and exceptions to ignore in Error Detection.
Configure Errors and Exceptions
AppDynamics automatically recognizes errors and exceptions for many common frameworks. You can customize the default error detection behavior as needed, for example, if you use your own custom error framework. See Error Detection.