Download PDF
Download page Data Binding.
Data Binding
You can use the Data panel to query and display data for a selected widget. Additionally, you can:
- Construct queries that span your environment.
Add important attributes and relationships to your queries.
Quickly access data when you do not know the metric path.
Construct sophisticated queries.
Query both metric and analytics data in the same query.
- Query custom metrics.
Data Queries
The Data panel is structured around queries. Each query follows a sentence-like format, starting with a selection of the data type of the query. Many fields in the Data panel support typeahead functionality.
In this example, you want to know errors per minute for the nodes in an application.
- Select a value from the Show me data for dropdown based on the data type you wish to display.

In this example, select Applications. - The subsequent inputs shown in the Data panel are specific to the data type you selected in the previous step. In this example, use the Application dropdown to select the application for which you want to drill down the data.

- The next dropdown is Metric. The Metric dropdown changes based on the data type. For example, the node displays two more inputs before you select the metric.
- Select the metric you wish to display on the widget. You can also click the vertical ellipsis
 to set the baseline, change the default metric function, set the limit, and change the default chart type.
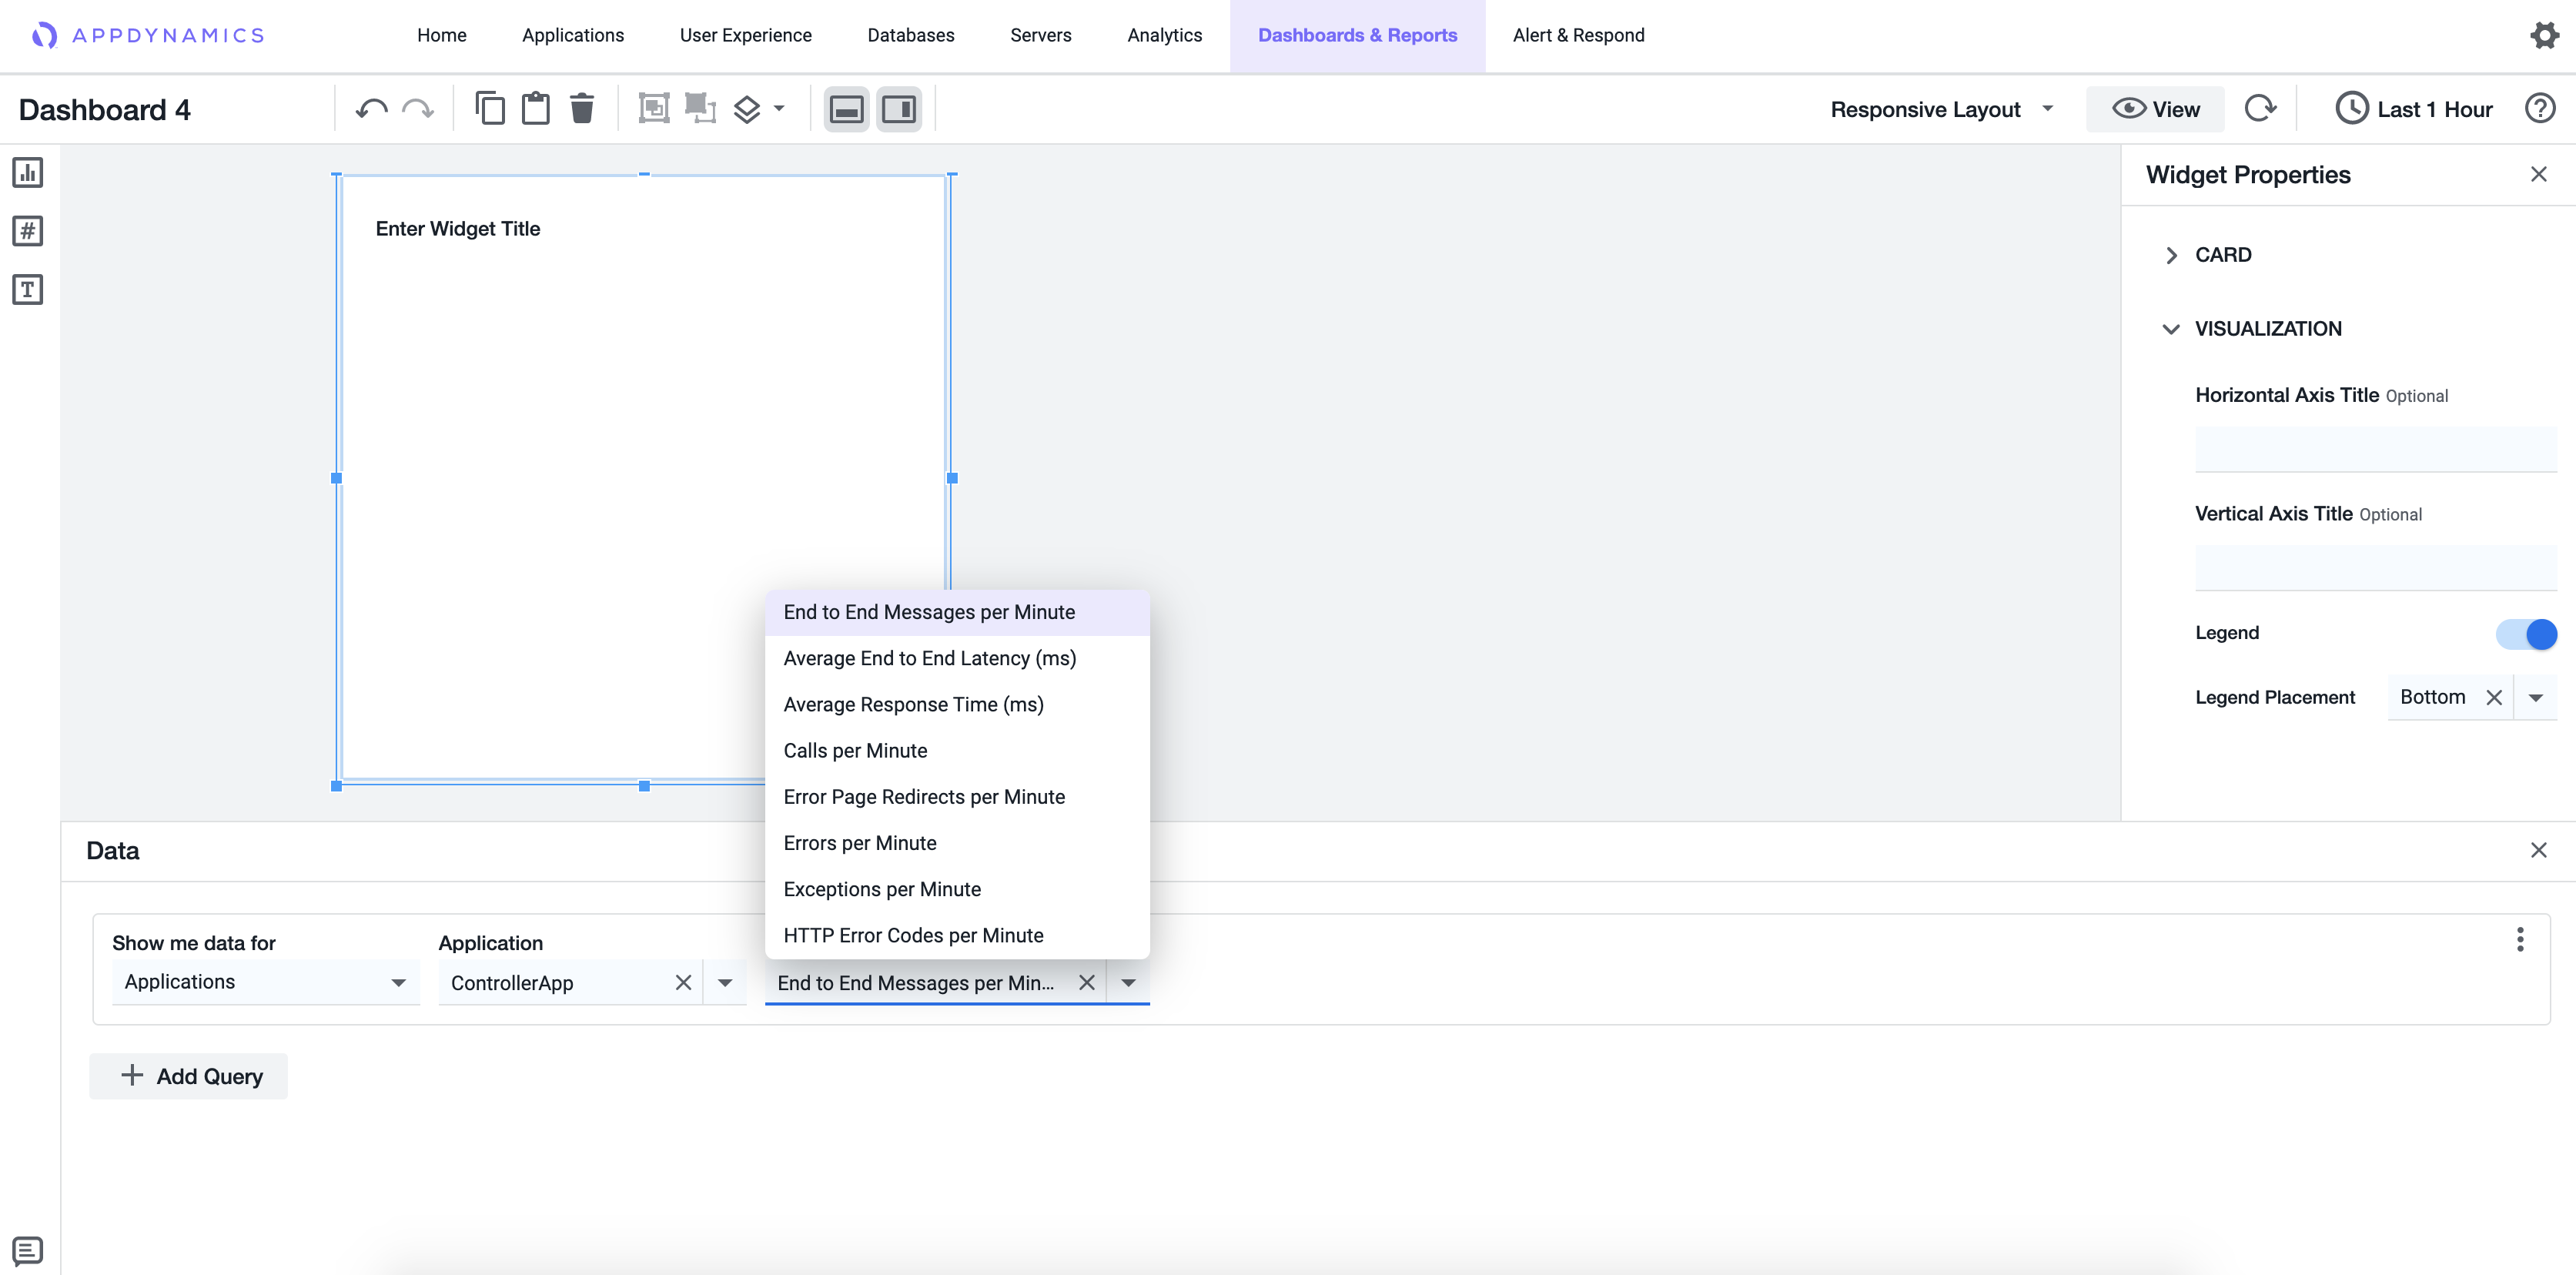
When you select the Function query option, Value is selected by default. You can change it to view your desired output.
The Function dropdown contains the following options:
- Value: Contains the average or the sum across the time range depending on the metric
- Minimum: Minimum value, only available for averaged metrics
- Maximum: Maximum value, only available for averaged metrics
- Sum: Aggregated value of the metric over the time range
- Count: Count of the observed values over the time range
- Current: Sum of the most recent minute's metric data values across all the included nodes
After you have specified valid inputs for all fields in the query, the widget is updated on the canvas and shows the query result.
Custom Query
The Custom query allows you to select any metric from the metric tree when binding data to a widget. You can configure it to display the metrics you have logged through the EUM or APM Agents. The query displays the metrics on Dash Studio to monitor the end-user performance.
In this example, you want to know the count of the slow query calls custom metric.
- On the Data panel, select Custom from Show me data for.

Select Applications.

You can select either applications, browser applications, or mobile applications. Applications is used for this example.
- The subsequent inputs shown on the Data panel are specific to the data type you selected in the previous step. Use the Application dropdown to select the application for which you want to drill down the data.
- The next dropdown is Metric Name. You can either copy and paste the absolute metric name or click Select to browse and choose the metric.

After you have specified valid inputs for all fields in the query, the widget is updated on the canvas and shows the query result.
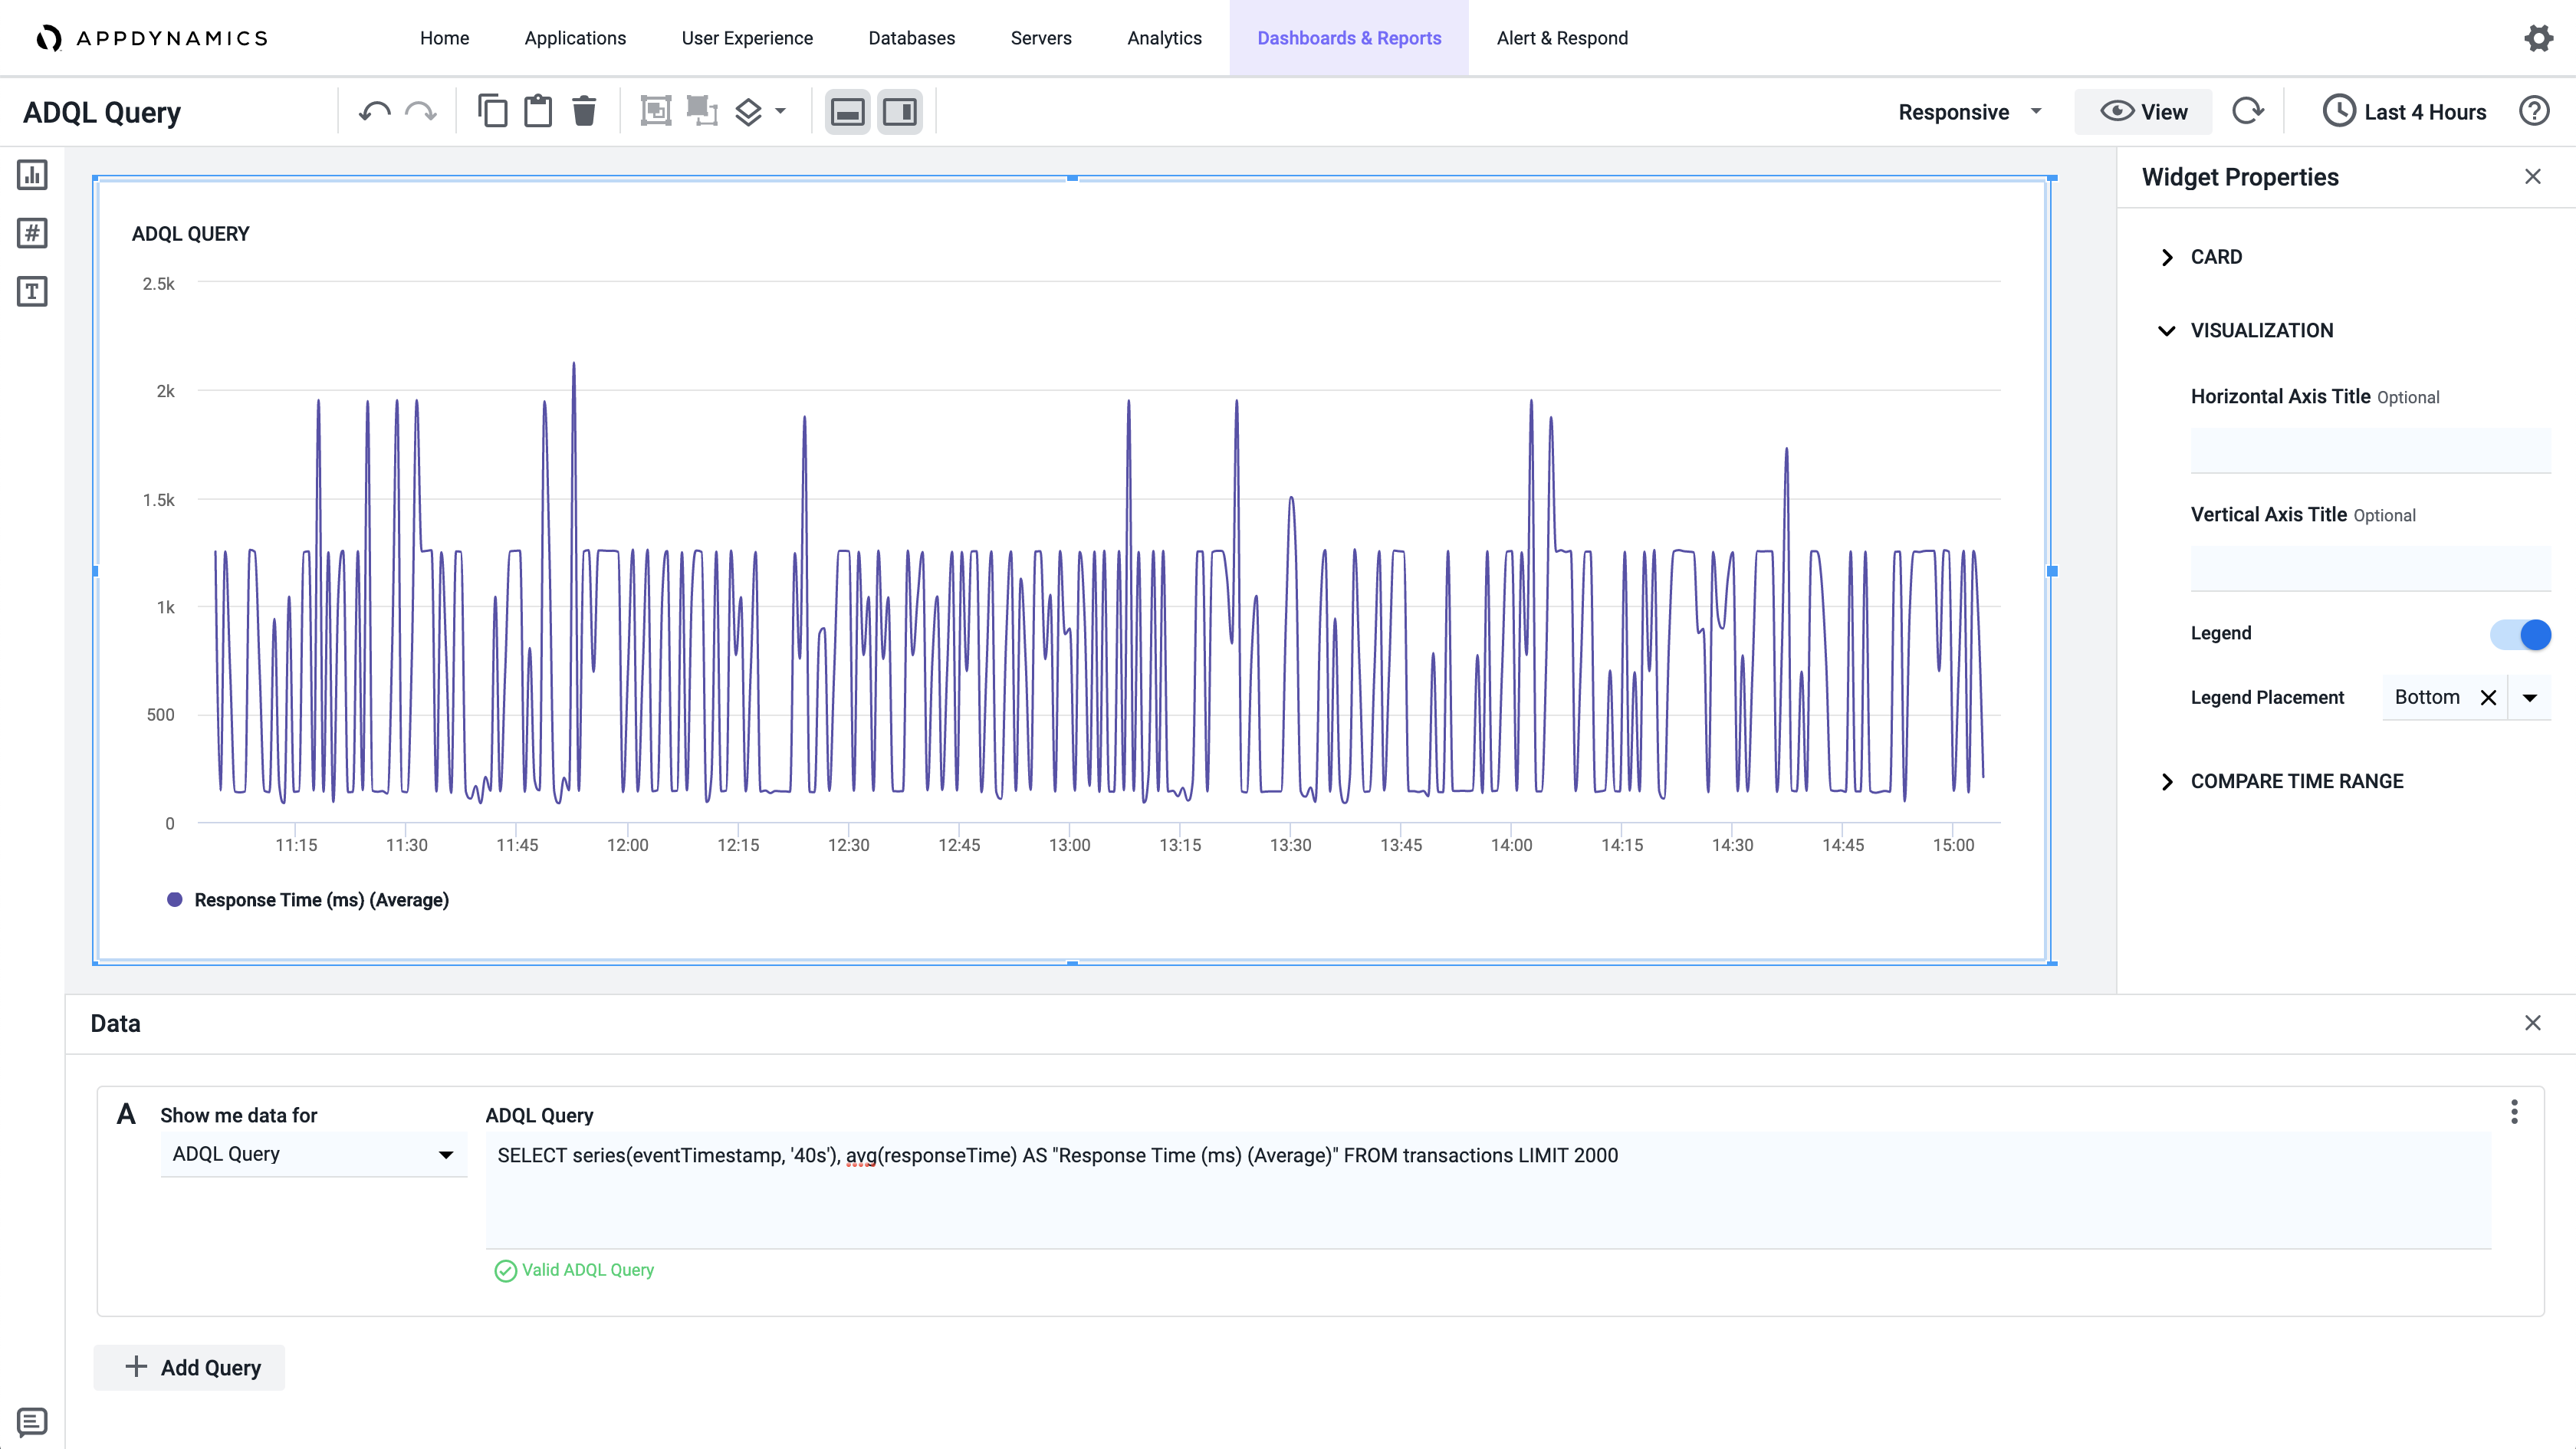
ADQL Queries
ADQL (AppDynamics Data Query Language) Query is a metrics query available in the Data panel for dashboards created in Dash Studio. Use this query to filter and create customized metrics for Analytics data.
ADQL Query data binding uses Analytics queries written in ADQL. After selecting the ADQL Query option from Show me data for dropdown, you can either type or paste an ADQL query. See ADQL Reference for the syntax of these query statements.
To view data reflected in the Time Series widget in Dash Studio, you must enter a valid ADQL Query for series. You must include the series expression in the ADQL query statement otherwise it does not display a series. ADQL Query is available for the Time Series widget only.
After you type or paste the query in the input field, moving the cursor away from the input field automatically validates the query. For a Valid ADQL Query (displayed in green), the data displays in the widget on the canvas. For any invalid query, an error message displays in red.
Variables in ADQL Queries
Variables in ADQL queries enable you to dynamically change the values passed into the queries.
For example, you want to use a variable for an application within an ADQL query.
- Click + Add Variable under the Dashboard Variables panel.
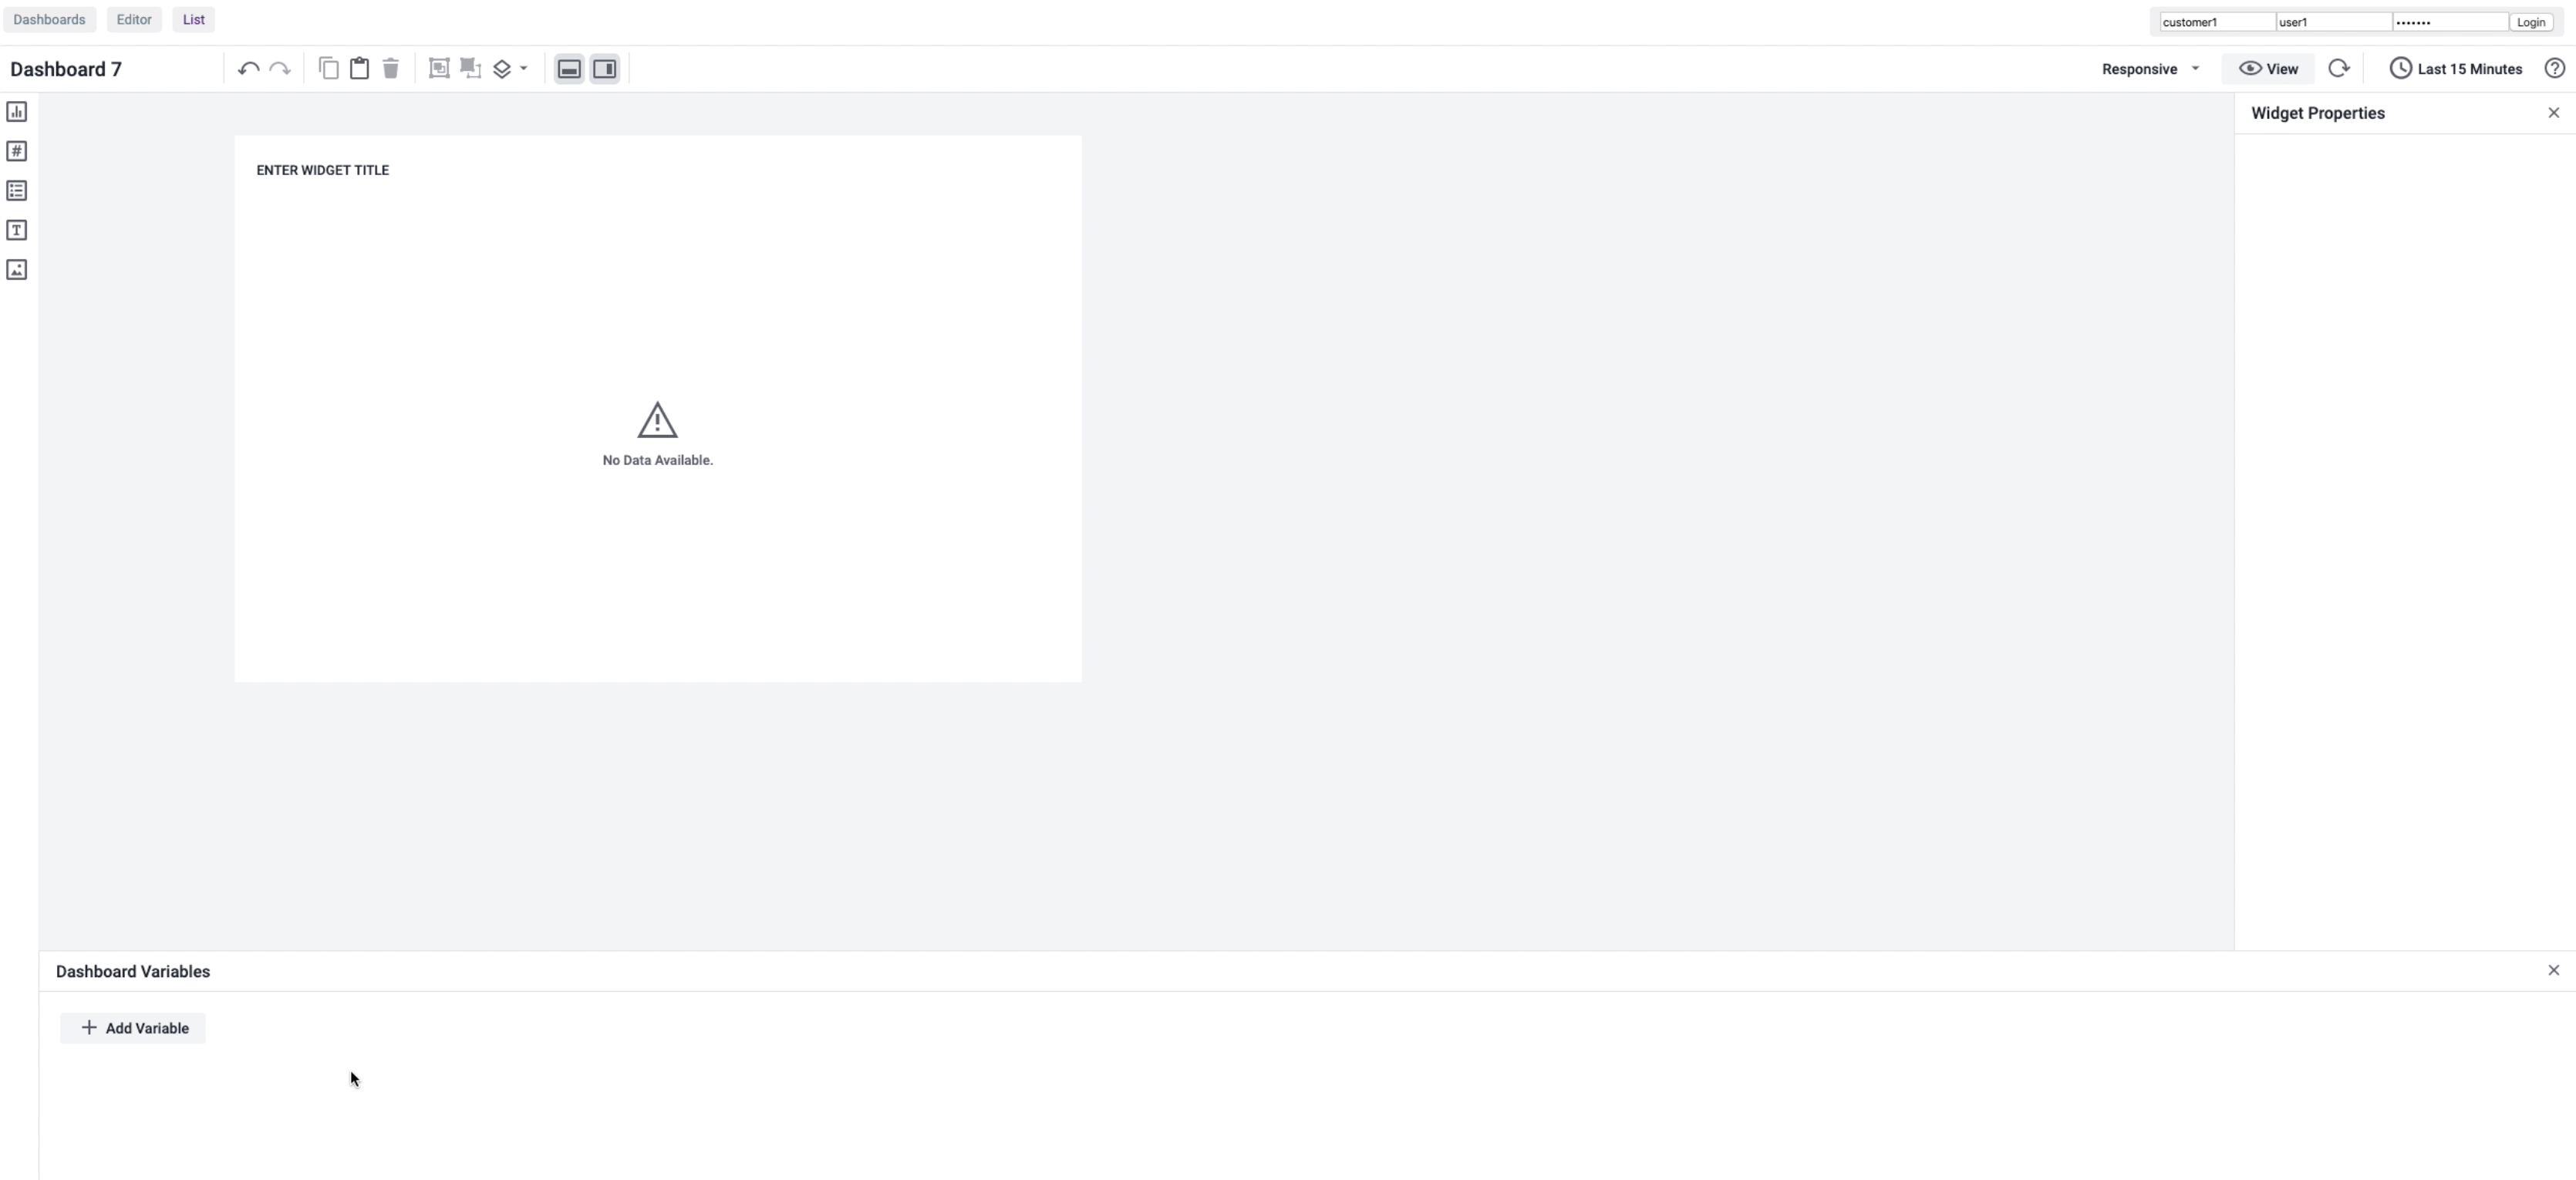
- Enter a value in the Variable Name field and select the variable type in the Type dropdown.

- Select an application in the Application dropdown.
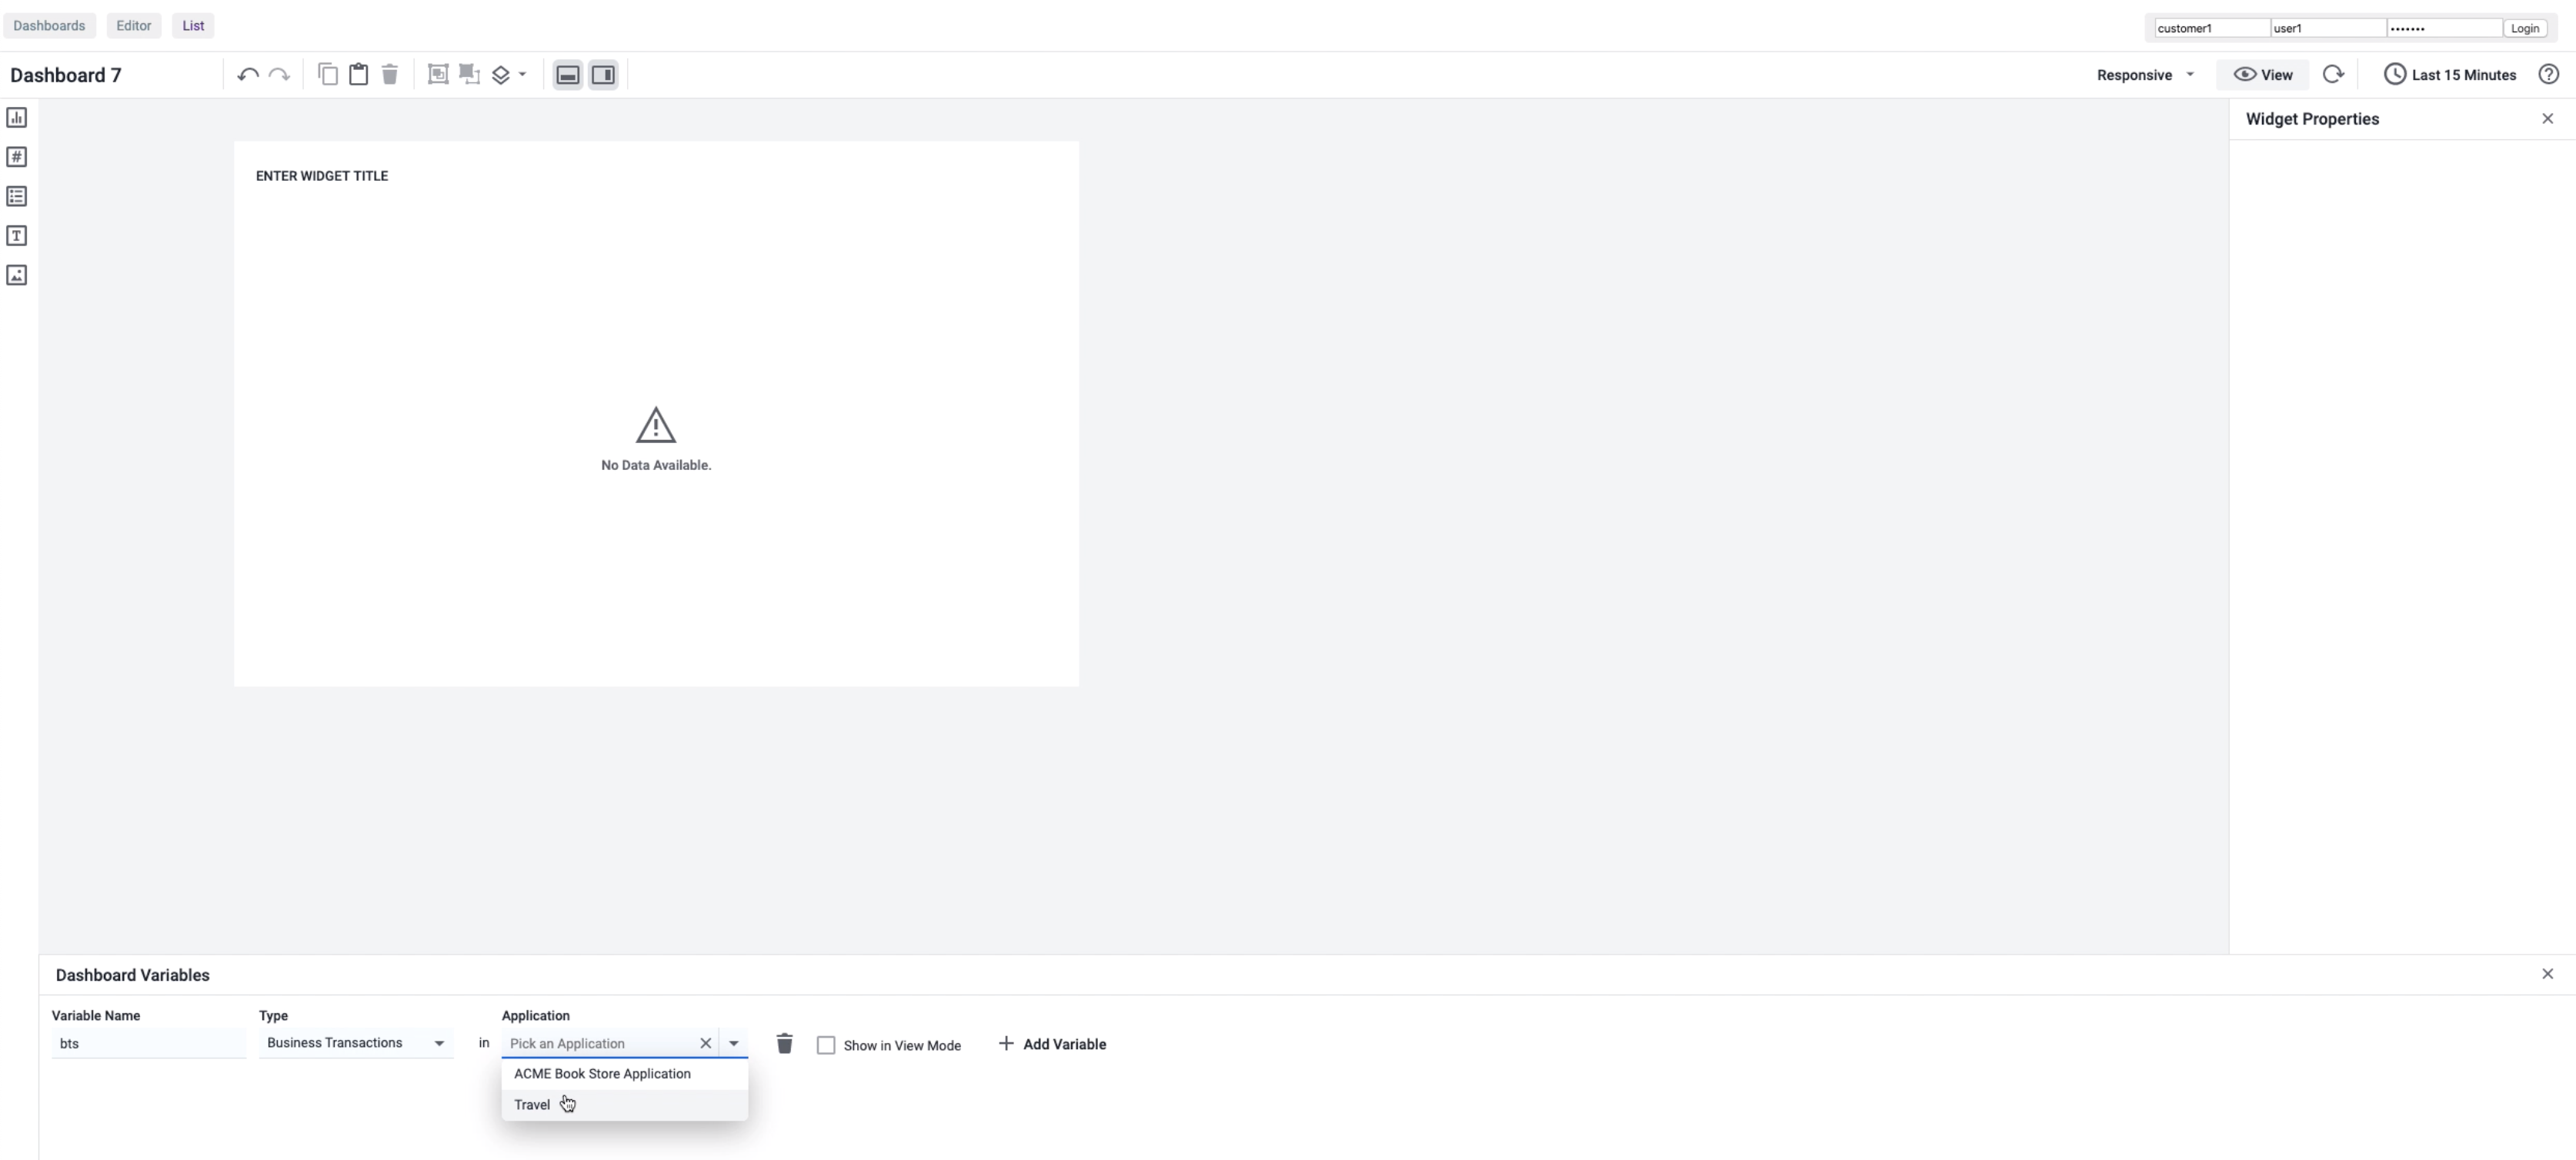
The subsequent inputs shown in the Dashboard Variables panel are specific to the data type selected in the previous step. In this example, it is the Initial Values dropdown, which enables you to select the business transaction for which you want to drill down the data.
Select the Initial Values, and then select the Show in View Mode checkbox.
Click the widget to change Data Panel from variable data to widget data.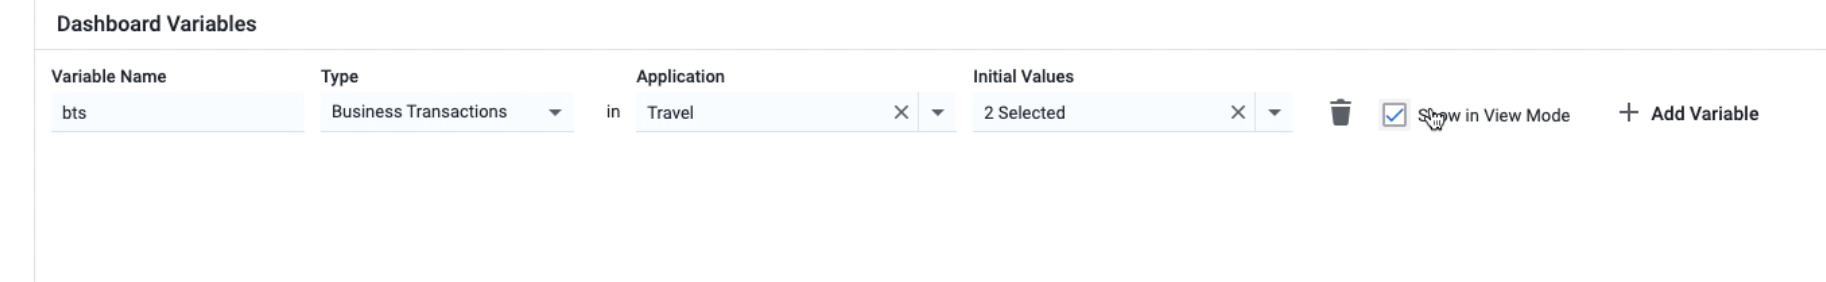
- Choose a value from the Show me data for dropdown.
In this example, select ADQL Query, and then enter the query in the ADQL Query field:
After you enter a valid query, the widget displays:
- Click View on the top-right of the page. The subsequent dashboard page enables you to change the application by clicking the $app dropdown.

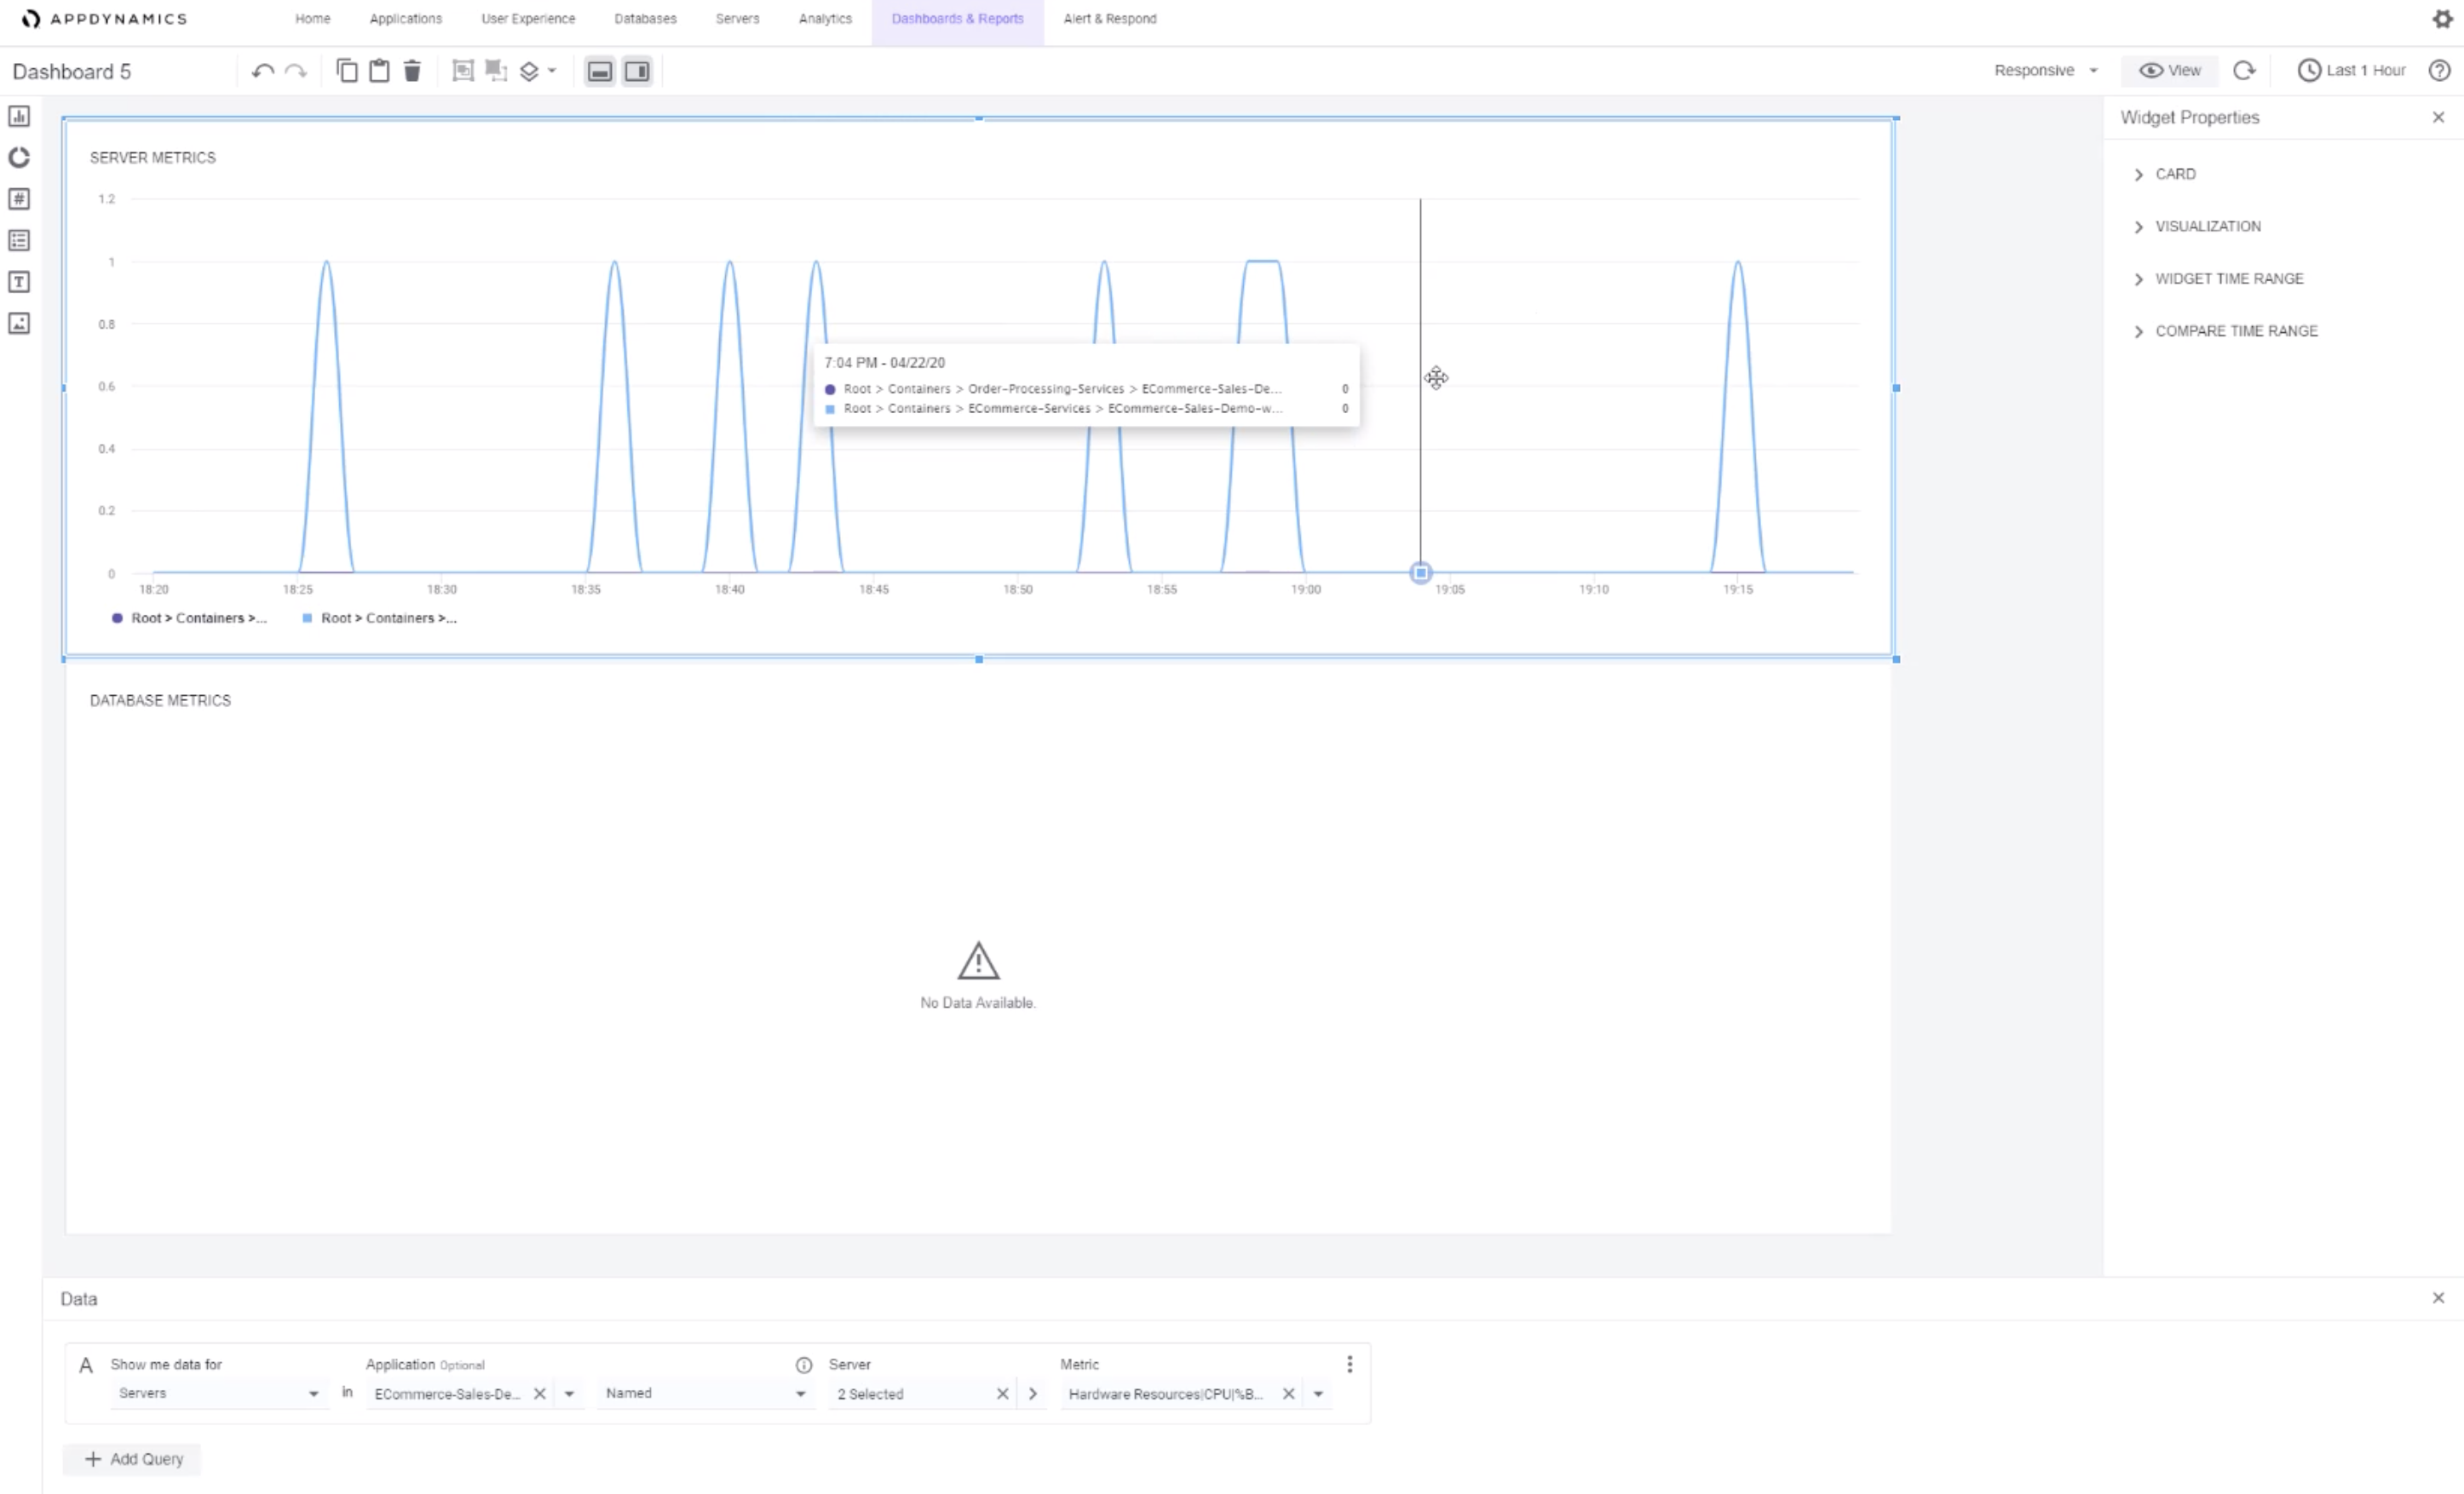
Server Metrics
Server Metrics [also known Server Infrastructure Monitoring (SIM) Metrics] is a data binding option available in the Data panel of Dash Studio. Use this option to filter and create customized metrics for server monitoring.
To filter and create customized metrics for one or more servers:
- Click the Show me data for dropdown and select Servers.

Click the Application dropdown and select the application for which you want to drill down the data.

- Click Select a Value and select one of these options:
All Servers: Select this option to show data across all applications. If you select this option, then the Application selected in the previous step becomes optional. If you select All Servers, the next input field in the Data panel automatically changes to Metric. Select the metric value you wish to display on the widget from the dropdown, or by manually entering a value in the input field.

If none of the applications are selected, then the widget displays data for stand-alone applications only, and not for the applications included in the application tree.
- Named: Select this option to specify individual servers known to the specific application that you chose in step 2. If you select Named, the next input field in the Data panel changes to Server. Select one or more servers from the Server dropdown, and the metric value from the Metric dropdown.
- Within: Select this option to select the tier, or tiers, of the server you wish to display in the server chart.
Database Metrics
Database Metrics is a data binding option available in the Data panel of Dash Studio. Use this option to filter and create customized metrics for database monitoring.
The Metric Number widget does not support Database metrics.
For example, to monitor a specific database or multiple databases:
- Click the Show me data for dropdown, and then select Databases.
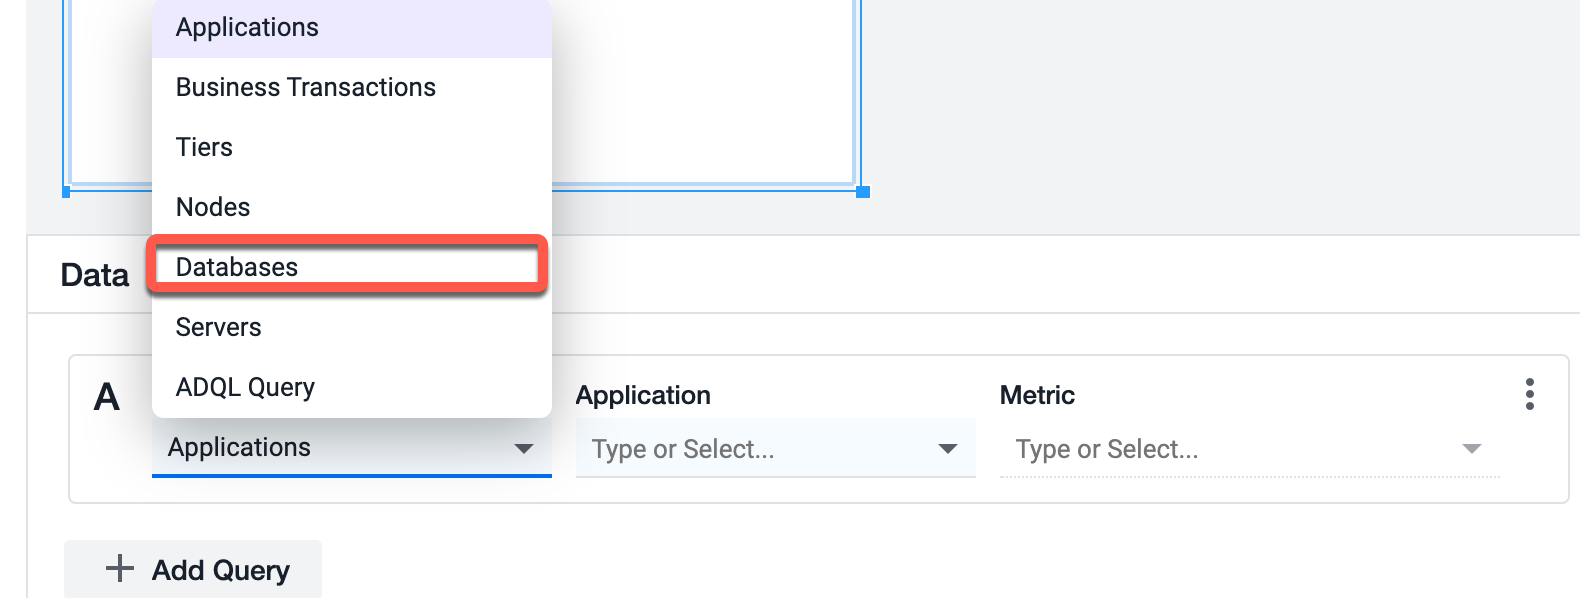
- Click Type and select the required database from the dropdown to display the metrics on the widget.

- Click Select a Value and choose one of these options:
All Databases: Displays data for all the databases.
- Named: Displays data for a specific database. You can select the required database from the subsequent input field Database that displays when you select Named.
Click Metric and select the metric value, or enter a value manually. The database metric chart displays.

JMX
JMX (Java Management Extensions) is a data binding option available in the Data panel for dashboards created in Dash Studio. Use this option to filter the entities by nodes and monitor the JMX metrics for the given set of nodes.
For example, to monitor JMX metrics of a node or multiple nodes:
- Click the Show me data for dropdown and select JMX.

The subsequent inputs shown in the Data panel are specific to the data type selected in this step. - Click the Application dropdown and select the application for which you want to drill down the data.
- Click Select a Value and select a node filter from the dropdown.

- Select a JMX metric. You can enter the name of the metric in the field manually or select from the dropdown. This list is dynamic.

- Entries do not display if the selected entry is not a Java application, or if there are no JMX metrics for the selected application.
The metric selector parses the Java Application metric tree dynamically for all available JMX metrics and displays them as a flattened list.
Currently, only the JMX metrics that are 2 levels deep from a JMX folder in the metric tree are available in Dash Studio.
Backends
Backends is a data binding option available in the Data panel for dashboards created in Dash Studio. Use this option to filter the backend entities.
To monitor Backends:
- Click the Show me data for the dropdown and select Backends.

- Click Type or Select and then select the application to display the metrics on the widget.

Click Select a Value and then select the filter you want to apply:
- Named
Name Starts with
Name Ends With
Name Contains
All Backend

Click Type or Select and then select a named filter from the list of options.
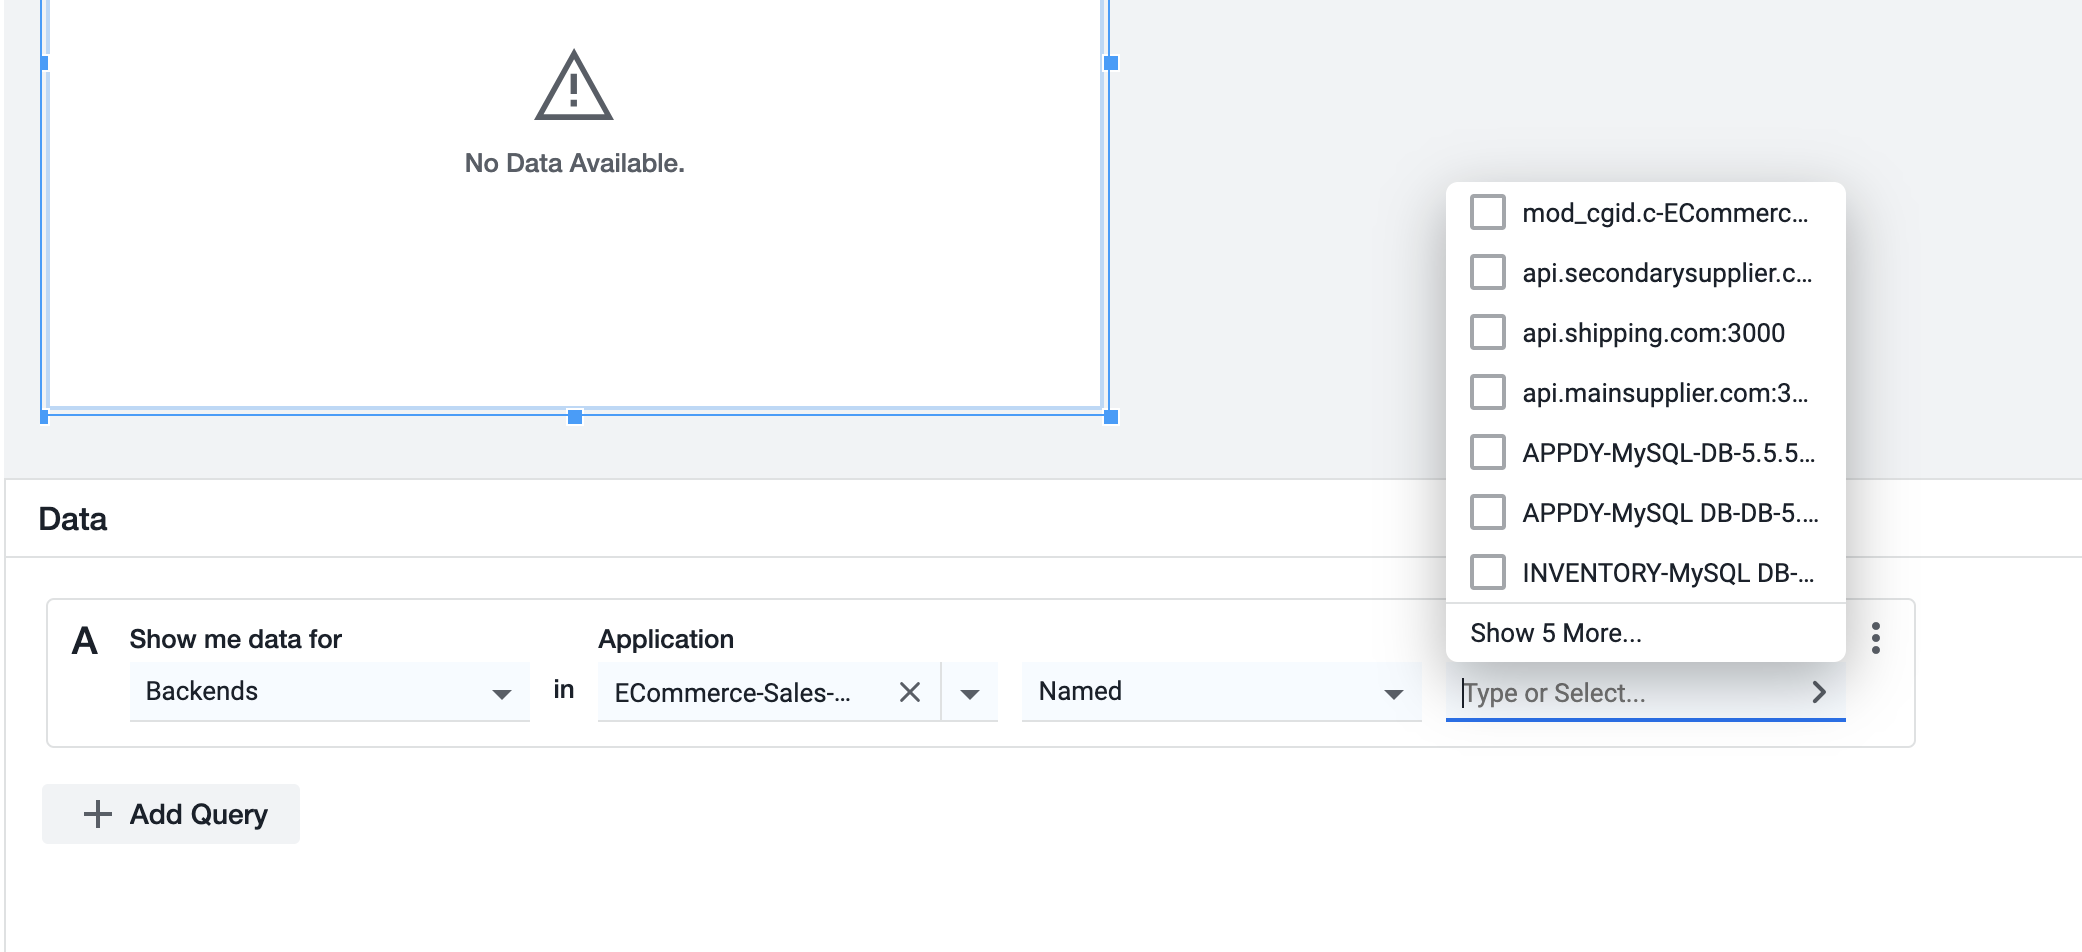
Click Metric and select the backend metric value.

The metric chart displays:

Errors Data Binding
Errors is a data binding option available in the Data panel for dashboards created in Dash Studio. Use this option to filter the error entities.
To monitor error entities:
- Click the Show me data for dropdown and then select Errors.

The subsequent inputs shown in the Data panel are specific to the data type selected in this step. - Click Type or Select and then select the application to display the metrics on the widget.

- Click Select a Value and then select the filter you want to apply.

- Click Type or Select and then select a named filter from the list of options.

- Click Metric and select the metric value.

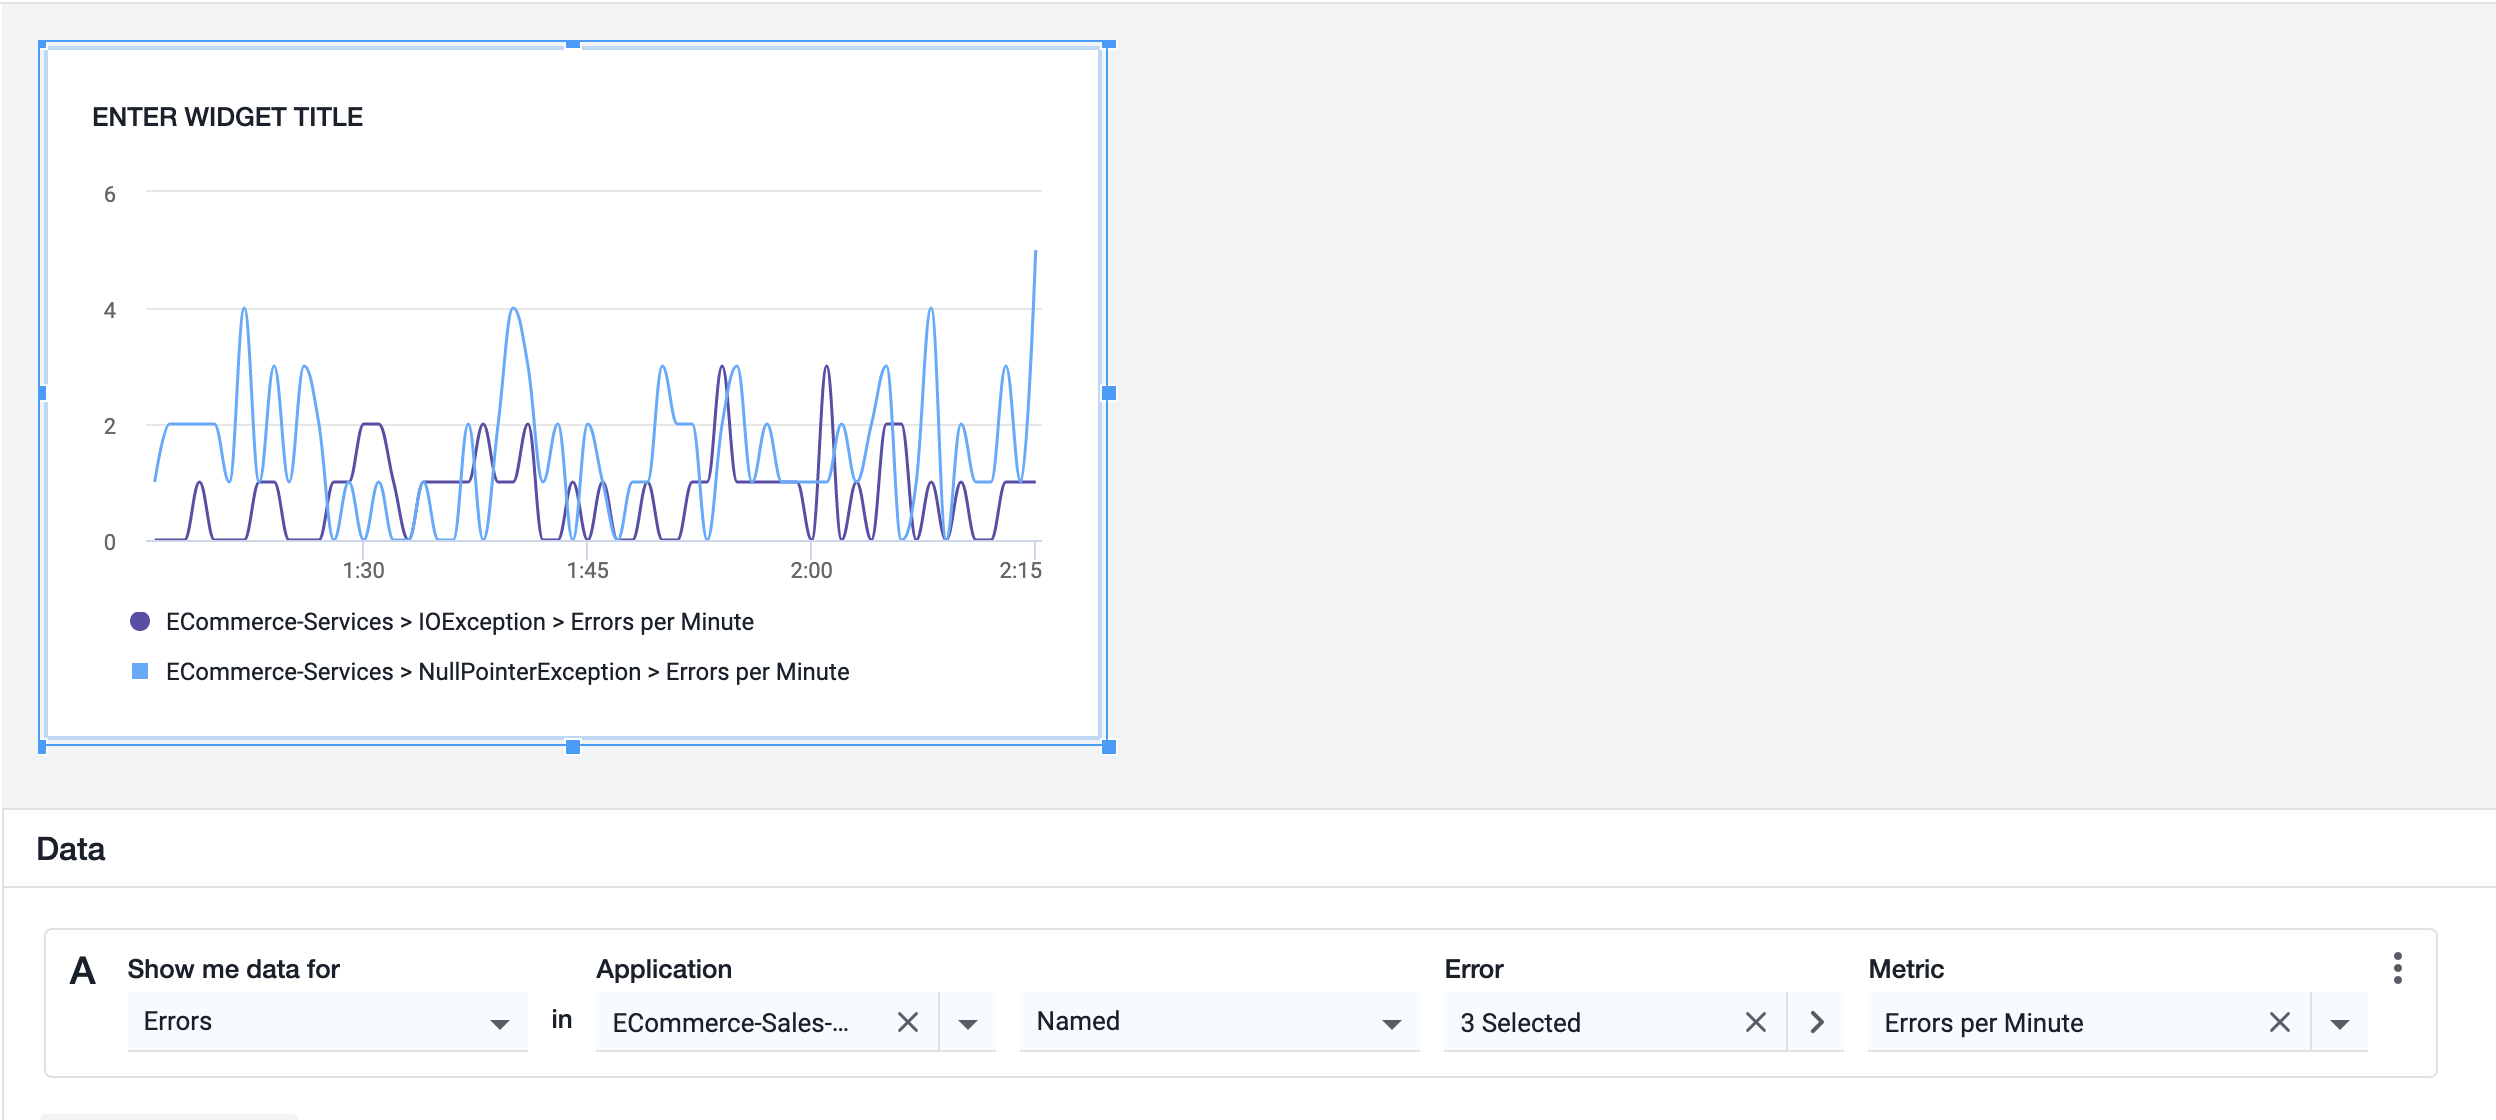
A chart that shows data for All Errors displays:

Browser Applications Metrics
Browser Applications metrics [also known as the Browser Real-User Monitoring (BRUM) metrics] is a data binding option available in the Data panel of Dash Studio. Use this option to filter and create customized metrics to view the performance of the web applications.
To filter and create customized metrics for one or more browser applications:
- Under Data panel, click the Show me data for dropdown and then select Browser Applications.

Click Application and then select the application for which you want to drill down the data.

The subsequent inputs shown in the Data panel are specific to the data type selected in the previous step.
- Click the Browser Entity Type dropdown and select an entity type from the list of options.

- Click Select a Value and select the filter that you want to apply.

- Click Type or Select and then select one or more browser applications from the list of options, or enter the name of the browser application in the input field manually.

Click Metric and select a metric value from the list of options.
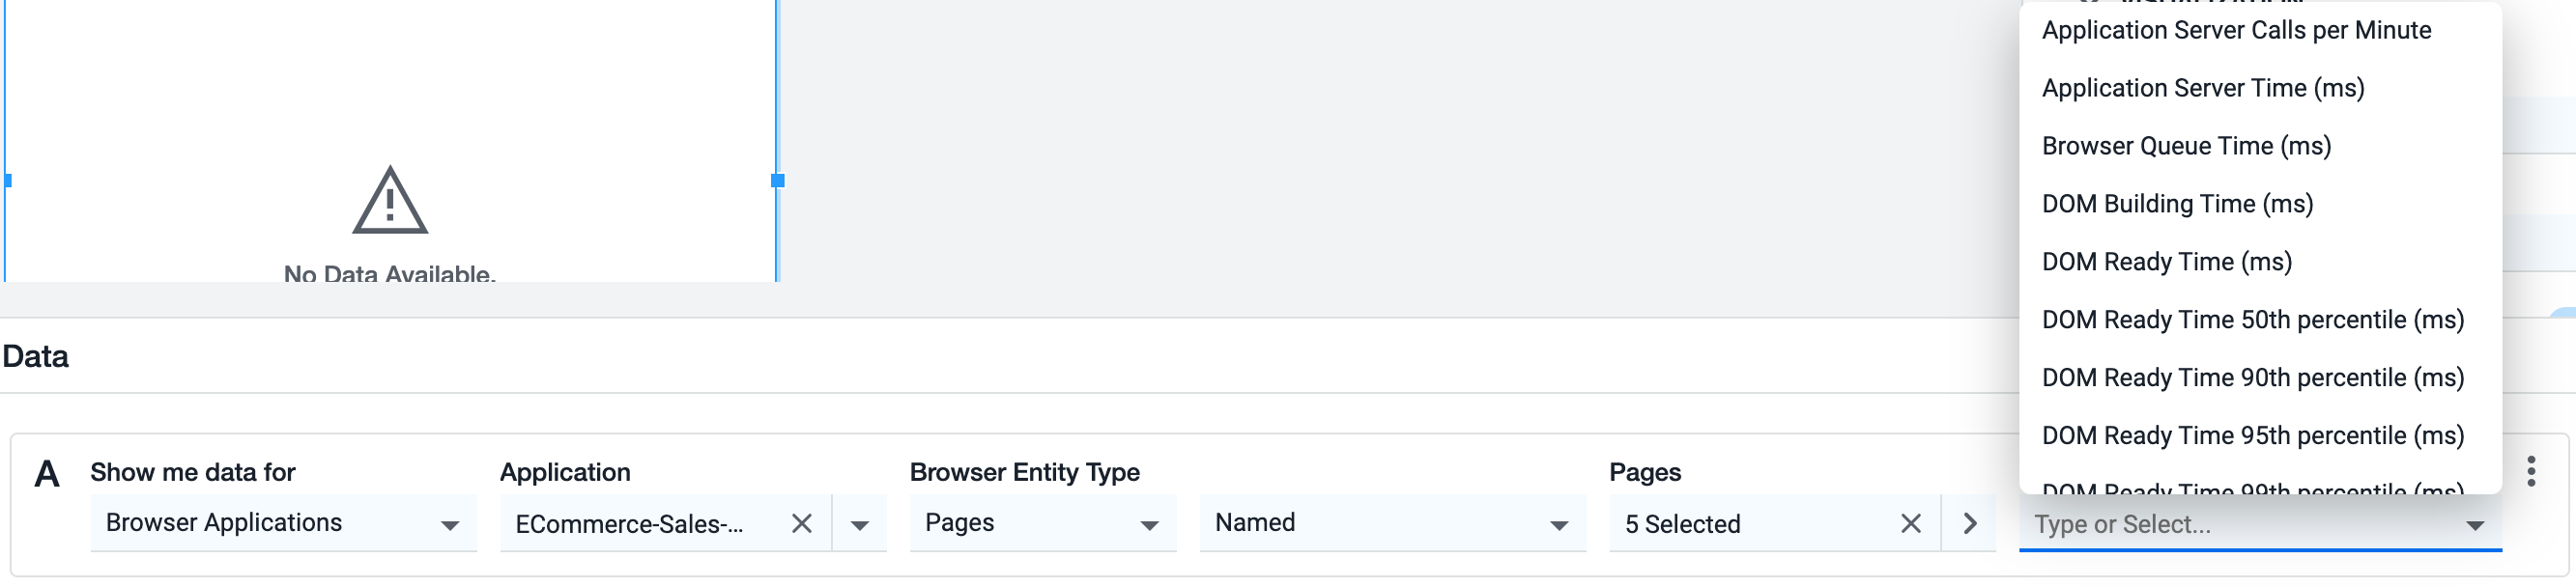
The Browser Applications metric chart displays:
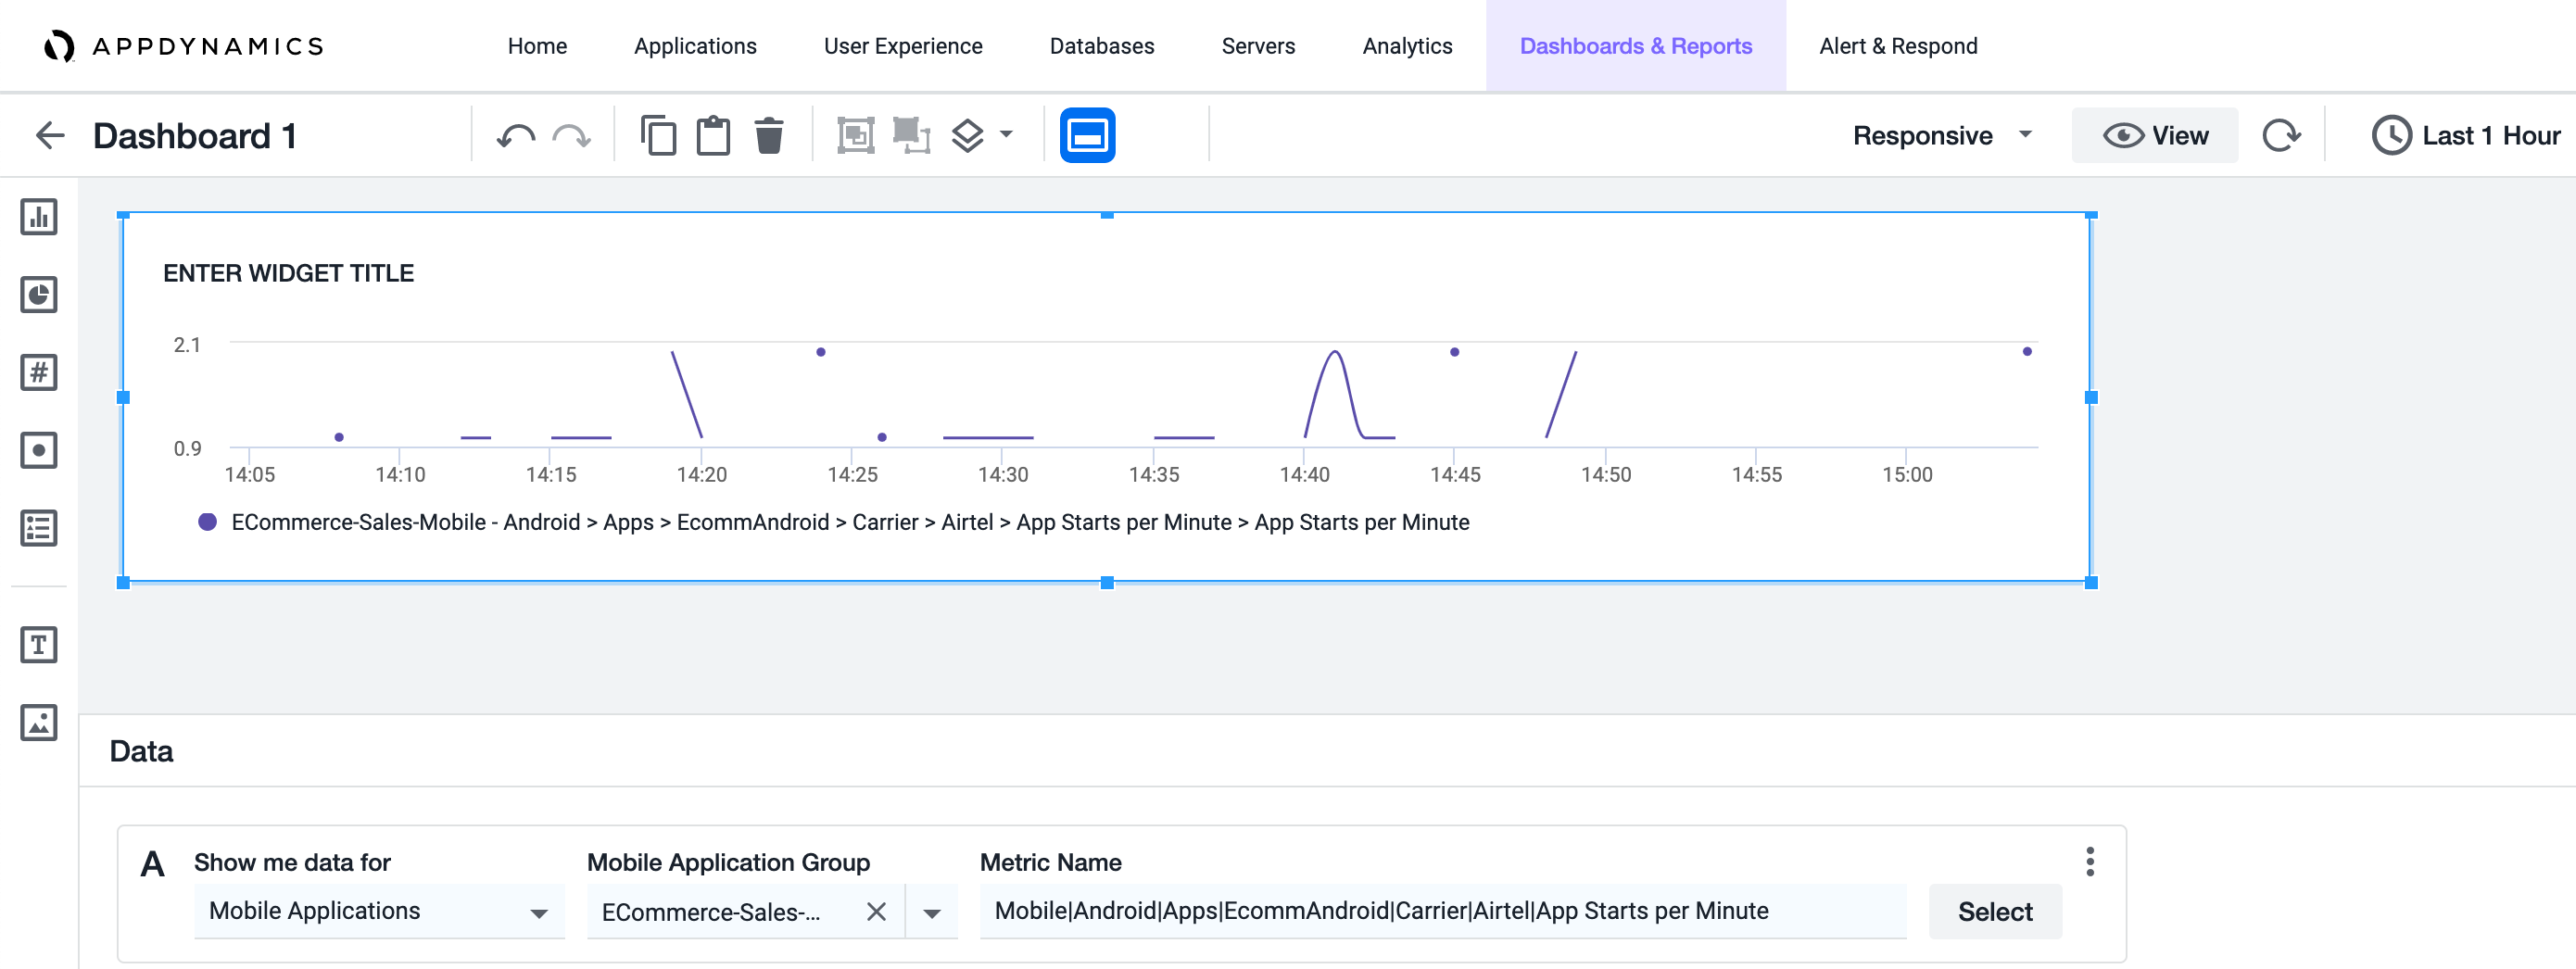
Mobile Applications Metrics
Mobile Applications metrics [also known as the Mobile Real-User Monitoring (MRUM) metrics] is a data binding option available in the Data panel of Dash Studio. Use this option to filter and create customized metrics to view the performance of mobile applications.
To filter and create customized metrics for one or more mobile applications:
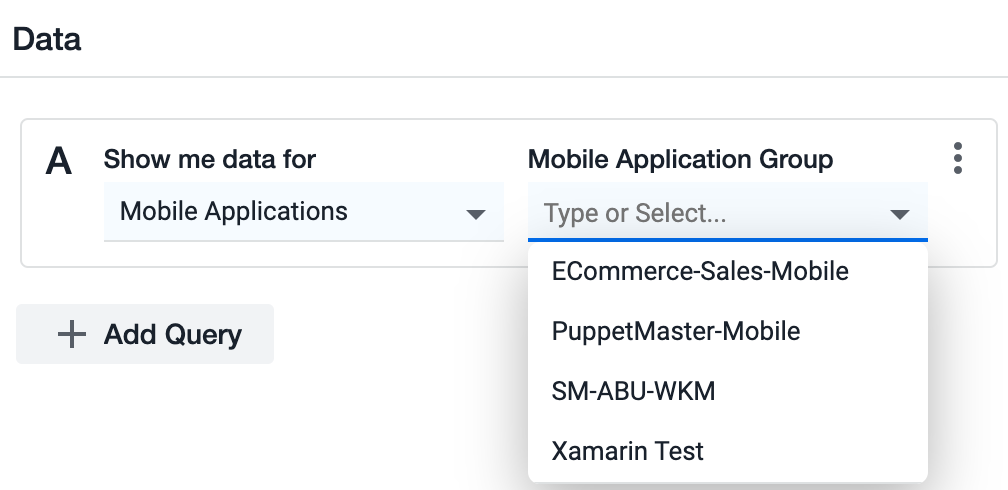
Under Data panel, click the Show me data for dropdown and select Mobile Applications.
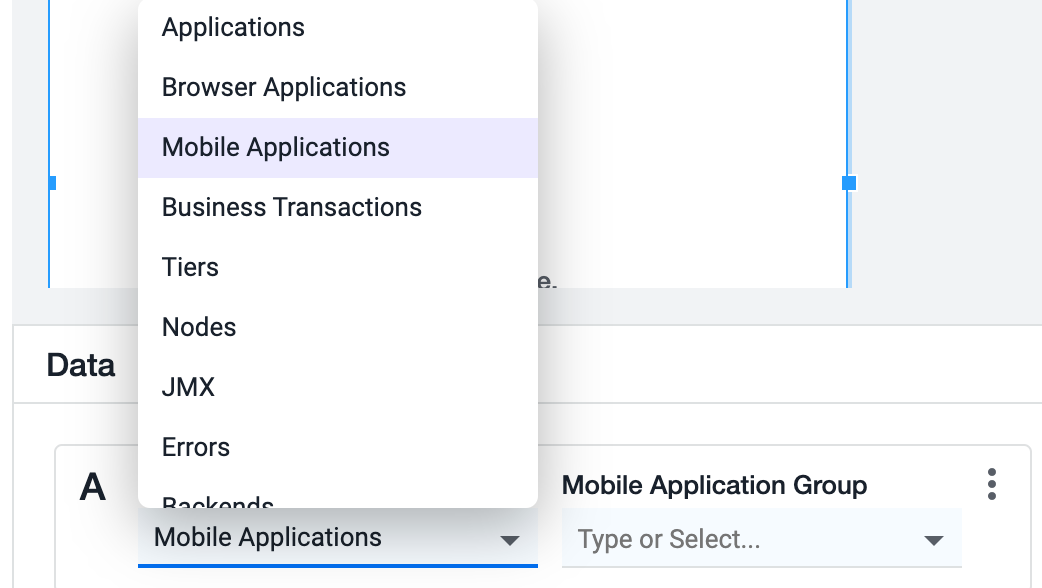
Click Mobile Application Group and then select the application for which you want to drill down the data.
- Click the Select under Metric Name dropdown and select a metric from the list of options.

- Click OK. The Mobile Applications metric chart displays: