Download PDF
Download page Hardware Resources Metrics.
Hardware Resources Metrics
This page describes the basic hardware metrics collected by the Machine Agent and the additional metrics collected by the Machine Agent for Server Visibility. Not all of the metrics that appear in the Hardware Resources branch of the Metric Browser tree are provided by the Machine Agent; some are collected by the Database Agent and are used in the Database Monitoring UI, while others might be custom metrics added by another extension run by your Machine Agent.
For most metrics in the Metric Browser, you can select any point in the graph to view more information about the metric observed at that point in time. The information includes the metric identifier, date and time of the observation, along with any of the following values relevant to the metric:
- Obs (observed value): Average of all data points seen for that interval. For a cluster or a time rollup, this represents the weighted average across nodes or over time.
- Min: Minimum data point value seen for that interval.
- Max: Maximum data point value seen for that interval.
- Sum: Sum of all data point values seen for that interval. For the Percentile Metric for the App Agent for Java, this is the result of the percentile value multiplied by the Count.
- Count: Number of data points generated for the metric in that interval. The collection interval for infrastructure metrics varies by environment.
CPU Metrics
| Metric Name | Description | Basic or Server Visibility | Windows | Linux1 | Solaris | AIX | Default Monitoring Mode 3 |
|---|---|---|---|---|---|---|---|
| %Idle | Percentage of time the CPU was idle; the CPU had completed its tasks and has nothing to do. | Basic | KPI | ||||
| %Busy | Percentage of time the CPU was busy processing system or user requests; this metric includes CPU Stolen time. | Basic | KPI | ||||
| %Stolen 4 | Usually, stolen time is the percentage of time a virtual CPU waits for a real CPU while the hypervisor is servicing another virtual processor. | Basic | KPI | ||||
| %Nice | Percentage of CPU time spent on low priority processes. | Server Visibility | Advanced | ||||
| System | Percentage of time the CPU was busy processing kernel code. | Server Visibility | KPI | ||||
| User | Percentage of time the CPU was busy processing non-kernel code. | Server Visibility | KPI | ||||
| IOWait | Percentage of CPU time spent waiting for an I/O request. | Server Visibility |
| KPI | |||
| %Irq | Percentage of CPU time spent servicing hardware interrupts. | Server Visibility | Diagnostic | ||||
| %SoftIrq | Percentage of CPU time spent servicing software interrupts. | Server Visibility | Advanced | ||||
| %Busy 95th Percentile 2 | The CPU %Busy percentage was at this level or lower 95% of the time. | Server Visibility | KPI | ||||
| IOWait 95th Percentile 2 | The CPU %Busy percentage was at this level or lower 95% of the time. | Server Visibility | KPI |
1 See Linux Kernel Processes.
2 See Percentile Metric Reporting must be Enabled.
3 See Default Monitoring Mode.
4 See Stolen Times are Reported Differently.
Memory Metrics
| Metric Name | Description | Basic or Server Visibility | Windows | Linux1 | Solaris | AIX | Default Monitoring Mode3 |
|---|---|---|---|---|---|---|---|
| Total (MB) | The total amount of memory. | Basic | KPI | ||||
| Used % | The percentage of memory used. | Basic | KPI | ||||
| Used (MB) | The amount of memory used. | Basic | Advanced | ||||
| Free % | Percentage of free or unused memory available for processes. | Basic | Advanced | ||||
| Free (MB) | The total amount of free or unused memory available for processes. | Basic | Advanced | ||||
| Swap Free (MB) | The total amount of free swap space. Reported for each hierarchical group. | Server Visibility | Advanced | ||||
| Swap Total (MB) | The total amount of allocated swap space. Reported for each hierarchical group. | Server Visibility | KPI | ||||
| Swap Used (MB) | The amount of swap space used. Reported for each hierarchical group. | Server Visibility | Advanced | ||||
| Swap Used % | The percentage of available swap space used. Reported for each hierarchical group. | Server Visibility | KPI | ||||
| Swap Free % | Percentage of free swap space. Reported for each hierarchical group. | Server Visibility | Advanced | ||||
| Pages Paged In 95th Percentile 2 | The paging-in rate to memory was at this level or lower 95% of the time. | Server Visibility | KPI | ||||
| Pages Paged Out 95th Percentile 2 | The paging-out rate from memory was at this level or lower 95% of the time. | Server Visibility | KPI | ||||
| Pages Swapped In 95th Percentile 2 | The swapping rate of pages from disks was at this level or lower 95% of the time. | Server Visibility | KPI | ||||
| Pages Swapped Out 95th Percentile 2 | The swapping rate of pages to disks was at this level or lower 95% of the time. | Server Visibility | KPI |
1 See Linux Kernel Processes.
2 See Percentile Metric Reporting must be Enabled.
3 See Default Monitoring Mode.
4 See Configure Free/Used Memory Metric Calculation on Linux.
Disk and Partition Metrics
The agent reports metrics for each disk partition and for disks in aggregate. Only mounted partitions and local partitions are reported.
SIGAR is not supported on Machine Agent.
| Metric Name | Description | Basic or Server Visibility | Windows | Linux | Solaris | AIX | Default Monitoring Mode1 |
|---|---|---|---|---|---|---|---|
| KB read/sec | The number of KB per second read from all disks and partitions. | Basic |
| Advanced | |||
| KB written/sec | The average amount of data per second written to all disks and partitions. | Basic | Advanced | ||||
| Reads/sec | Number of read operations per second performed on all disks and partitions. | Basic |
| KPI | |||
| Writes/sec | Number of write operations per second performed on all disk and partitions. | Basic | KPI | ||||
| Avg IO Utilization (%) | The average time spent processing read/write requests on all disks and partitions as a percentage of the total reported time window. Databases often report high disk I/O utilization due to frequent read/write requests. For example, if the agent detects read/write processing in 55 out of 60 seconds, the Avg IO Utilization for that minute is 92%. This metric does not measure the amount of available disk space or read/write request sizes. | Server Visibility |
| KPI | |||
| <partition> %CPU Time | The percentage of CPU processing consumed by a partition during read and write operations. | Basic (HardwareMonitor)6 | Diagnostic | ||||
| <partition> Avg Service Time (ms) | Time in milliseconds spent performing read and write operations across one partition. | Basic (HardwareMonitor)6 | Diagnostic | ||||
| <partition> Avg Queue Time (ms) | Time in milliseconds that a read or write request is in the queue before it gets processed across one partition. | Basic (HardwareMonitor)6 | KPI | ||||
| <partition> KB read/sec | The average amount of data per second read from one specific partition. | Basic (HardwareMonitor)6 | Diagnostic | ||||
| <partition> KB written/sec | The average amount of data per second written to one specific partition. | Basic (HardwareMonitor)6 | Diagnostic | ||||
<partition> | Number of read operations per second performed on one specific partition. | Basic (HardwareMonitor)6 | KPI | ||||
<partition> | Number of write operations per second performed on one specific partition. | Basic (HardwareMonitor)6 | KPI | ||||
<partition> | The amount of unused or free disk space on a specific partition in KB. | Basic (HardwareMonitor)6 | KPI | ||||
<partition> | The amount of used or unavailable disk space on a specific partition in KB. | Basic (HardwareMonitor)6 |
| Advanced | |||
| <partition> Avg IO Utilization (%) | The average time spent processing read/write requests as a percentage of the total reported time window. Databases often report high disk I/O utilization due to frequent read/write requests. For example, if the agent detects read/write processing in 55 out of 60 seconds, the Avg IO Utilization for that minute is 92%. This metric does not measure the amount of available disk space or read/write request sizes. | Server Visibility |
| KPI | |||
| <partition> Avg read time (ms) | The average time in milliseconds required to service a read request by all disks or by one specific disk or across one partition. | Server Visibility | KPI | ||||
| <partition> Avg write time (ms) | The average time in milliseconds required to service a write request across one partition. | Server Visibility | | KPI | |||
| <partition> Queue Time 95th Percentile 3 | The queue time for read/write requests was this long or shorter 95% of the time for the reported time window. | Server Visibility | KPI |
1 See Default Monitoring Mode.
2 For some versions of Windows Server 2008 and Windows Vista, the Hardware Resources|Disks|<partition>|Avg Read Time (ms) and Hardware Resources|Disks|<partition>|Avg Write Time (ms) metrics will be reported as 0. This is due to a known bug with Windows. To resolve this issue, download the hotfix: https://support.microsoft.com/en-us/kb/961435.
3 See Percentile Metric Reporting must be Enabled.
4 See Configure Disk Usage Metric Collection on Linux.
5 See HardwareMonitor and JavaHardwareMonitor Calculate "Writes/Sec" Differently on AIX Machines
6For Basic (HardwareMonitor) metrics, the following variables must be set as:
<MA-Home>/monitors/JavaHardwareMonitor: false<MA-Home>/monitors/HardwareMonitor: true<MA-Home>/extensions/ServerMonitoring/conf/ServerMonitoring.yaml: SetbasicEnabledto true
Volume Metrics
AppDynamics Server Visibility retrieves the volume space metrics on POSIX systems using the df command. The volume metrics are reported across all listed volumes and for each volume at a specified mount point, such as "/boot". Only local volumes are reported.
| Metric Name | Description | Basic or Server Visibility | Windows | Linux1 | Solaris2 | AIX | Default Monitoring Mode3 |
|---|---|---|---|---|---|---|---|
| Total (MB) | The amount of storage space available (used and free) across all listed volumes or at the specified mount point. On Linux, the space reserved for root is not counted in the available space. | Server Visibility | KPI | ||||
| Free (MB) | The amount of unused or free space across all listed volumes or on the selected volume at the specified mount point. On Linux, the space reserved for root is not counted in the available space. | Server Visibility | Advanced (volume) | ||||
| Used (MB) | The amount of storage space in use across all listed volumes or on the selected volume at the specified mount point. | Server Visibility | Advanced (volume) | ||||
| Used (%) | The percentage of storage space in use across all listed volumes or on the selected volume at the specified mount point. | Server Visibility | KPI | ||||
| Count | The number of partitions for which storage space metrics are collected. | Server Visibility | KPI | ||||
| <partition> Free (MB) | The amount of unused or free space for <partition>. | Server Visibility | KPI | ||||
| <partition> Total (MB) | The amount of storage space available (used and free) for <partition>. | Server Visibility | KPI | ||||
| <partition> Used (%) | The percentage of storage space in use for <partition>. | Server Visibility | KPI | ||||
| <partition> Used (MB) | The amount of storage space in use for <partition>. | Server Visibility | Advanced |
1 Only /dev volumes are monitored on Linux.
2 Only /dev/dsk and /rpool volumes are monitored on Solaris.
3 See Default Monitoring Mode.
Load Metrics
The load metrics are reported for each machine. The CPU % (reported as part of the basic Machine Agent metrics) is the percentage of the CPU consumed by processes that are currently running. Load takes into account processes that are waiting to run. These metrics are shown as percentages in the Server Dashboard and are scaled by 100 in the Metric Browser.
| Metric Name | Description | Basic or Server Visibility | Windows | Linux | Solaris | AIX | Default Monitoring Mode1 |
|---|---|---|---|---|---|---|---|
| Last 1 minute | CPU Load, presented as an average over the last 1 minute. | Server Visibility | KPI | ||||
| Last 5 minutes | CPU Load, presented as an average over the last 5 minutes. | Server Visibility | KPI | ||||
| Last 15 minutes | CPU Load, presented as an average over the last 15 minutes. | Server Visibility | KPI |
1 See Default Monitoring Mode.
Machine Metrics
| Metric Name | Description | Basic or Server Visibility | Windows | Linux | Solaris | AIX | Default Monitoring Mode1 |
|---|---|---|---|---|---|---|---|
| Availability | The percentage of time the Machine Agent was reporting to the Controller. In the Server Visibility UI, this provides a percentage with 6 digits of precision (for example, 100.0000) to measure availability. The Machine Agent sends a heartbeat to the AppDynamics Controller once per minute to indicate the agent is reporting. Reported for each machine. | Server Visibility | KPI |
1 See Default Monitoring Mode.
Network Metrics
The Machine Agent is configured to ignore virtual networks by default. See Machine Agent Settings for Server Visibility.
| Metric Name | Description | Basic or Server Visibility | Windows | Linux | Solaris | AIX | Default Monitoring Mode1 |
|---|---|---|---|---|---|---|---|
| Incoming KB 2 | The volume of data received by all monitored network devices. | Basic | Advanced | ||||
| Incoming KB/sec | The amount of data per second received by all monitored network devices. | Basic | KPI | ||||
| Incoming packets 2 | The number of packets received by all monitored network devices. | Basic | Advanced | ||||
| Incoming packets/sec | The number of data packets per second received by all monitored network devices. | Basic | Advanced | ||||
| Outgoing KB 2 | The volume of data sent by all monitored network devices. | Basic | Advanced | ||||
| Outgoing KB/sec | The volume of data sent per second by all monitored network devices. | Basic | KPI | ||||
| Outgoing packets 2 | The number of packets sent by all monitored network devices. | Basic | Advanced | ||||
| Outgoing packets/sec | The number of data packets sent per second by all monitored network devices. | Basic | Advanced | ||||
| Incoming Errors/min | The number of incoming packet errors the network incurs every minute. | Server Visibility | KPI | ||||
| Outgoing Errors/min | The number of outgoing packet errors the network incurs every minute. | Server Visibility | KPI | ||||
| Avg Utilization (%) | The average network utilization as a percentage of the maximum possible throughput. This metric is not reported if the agent cannot determine the throughput (not supported for some devices and Linux versions). The percentage is rounded to the nearest integer. Therefore, very low utilization may be reported as 0%. Reported for:
| Server Visibility | KPI | ||||
| <network interface> Incoming KB | The volume of data received by the selected network interface. | Basic | Advanced | ||||
| <network interface> Incoming KB/sec | The volume of data received per second by the selected network interface. | Basic | KPI | ||||
| <network interface> Incoming packets | The number of data packets received by the selected network interface. | Basic | Advanced | ||||
| <network interface> Incoming packets/sec | The number of data packets received per second by the selected network interface. | Basic | Advanced | ||||
| <network interface> Outgoing KB | The volume of data sent by the selected network interface. | Basic | Advanced | ||||
| <network interface> Outgoing KB/sec | The volume of data sent per second by all monitored network interface. | Basic | KPI | ||||
| <network interface> Outgoing packets | The number of data packets sent per second by the selected network interface. | Basic | Advanced | ||||
| <network interface> Outgoing packets/sec | The number of data packets sent per second by the selected network interface. | Basic | Advanced | ||||
<network interface> | The number of incoming packet errors the network incurs every minute. | Server Visibility | KPI | ||||
<network interface> | The number of outgoing packet errors the network incurs every minute. | Server Visibility | KPI |
1 See Default Monitoring Mode.
2 The ServerMonitoring and JavaHardwareMonitor extensions calculate unidirectional throughput (packet/KB) metrics differently. ServerMonitoring reports the total number of packets/bytes in the last minute. JavaHardwareMonitor reports the total number of packets/bytes from the time the Machine Agent started.
Process Metrics
The following metrics are aggregated and reported for each process or process class (except Total Process Count, which measures all processes observed by the agent). See Machine Agent Settings for Server Visibility to modify the default process monitoring.
| Metric Name | Description | Basic or Server Visibility | Windows | Linux1 | Solaris2 | AIX | Default Monitoring Mode3 |
|---|---|---|---|---|---|---|---|
| Count | The number of processes in this class consuming CPU or memory resources or the total number of processes in this class. | Server Visibility | KPI | ||||
| CPU Used (%) | Percentage of the CPU bandwidth used by all processes in a process class. A process using 100% CPU is executing on all processors on the system. If there are four cores on the machine and the process is executing four threads, each executing on one core, then the process can use up to 400% CPU. If there are four cores on the machine and the process is executing one thread on one core, then the process can use up to 25% CPU. | Server Visibility | KPI | ||||
| Major Faults/sec | Number of major page faults caused by all processes in this class. | Server Visibility | Diagnostic | ||||
| Minor Faults/sec | Number of minor page faults caused by all processes in this class. | Server Visibility | Diagnostic | ||||
| Memory Used (%) | Percentage of memory consumed by the top 10 consuming processes or the percentage of memory used by all processes in this class. | Server Visibility | KPI | ||||
| Memory Used (KB) | Amount of memory used by all processes in this class. | Server Visibility | Advanced | ||||
| Memory Virtual (KB) | Current size of the virtual address space that the process is using. Use of virtual address space does not necessarily imply a corresponding use of either disk or main memory pages. Virtual space is finite and, by using too much, the process can limit its ability to load libraries. | Server Visibility | Advanced | ||||
| Thread Count | The number of kernel threads used by all processes in this class. | Server Visibility | Diagnostic | ||||
| Total Process Count | All individual processes observed by the Machine Agent, before it filters out unreported processes and groups the remaining processes into classes. You can use this metric to identify anomalies in the number of processes running on a specific machine. For example, if the average Total Process Count on a machine is usually 200 to 300, and then suddenly rises to 2000 or more, this could indicate a problem on that machine. To collect this metric, the Machine Agent captures the number of processes every 30 seconds and calculates the average number of processes per minute.
| Server Visibility | KPI |
1 See Linux Kernel Processes.
2 When collecting Process metrics on Solaris, the Machine Agent observes and captures only the first 80 characters of each process name and argument list. The agent considers only the first 80 characters of each process string when it applies allowlists ("always monitor this process") and blocklists ("never monitor this process") defined in ServerMonitoring.yml.
3 See Default Monitoring Mode.
Service Availability Metrics
Reported for each service that is configured.
| Metric Name | Description | Basic or Server Visibility | Windows | Linux | Solaris | AIX | Default Monitoring Mode1 |
|---|---|---|---|---|---|---|---|
| Response Time (ms) | The elapsed time between sending a request and receiving a response from the monitored service. | Server Visibility | KPI | ||||
| Response Size (bytes) | The size of the response received from the monitored service. | Server Visibility | KPI | ||||
| Success Rate (%) | The percentage of successful requests over all requests made to the service. | Server Visibility | KPI |
1 See Default Monitoring Mode.
Enable Percentile Metric Reporting
You must enable percentile metric reporting on both the Controller and the Machine Agent. By default, reporting is disabled on the Controller and enabled on the Machine Agent.
- To enable/disable reporting on the Controller, log in to the Controller Administration Console and set the
sim.machines.percentile.percentileMonitoringAllowedproperty. See Controller Settings for Machine Agents. - To enable/disable reporting on the agent, open the
<machine_agent_home>/extensions/ServerMonitoring/conf/ServerMonitoring.ymlfile and set thepercentileEnabledproperty. See Machine Agent Settings for Server Visibility.
Configure Disk Usage Metric Collection on Linux
You can configure the Linux Machine Agent to calculate the following metrics similar to using the Linux df command:
- Servers > Volumes > /opt > Disk Usage
- Metric Browser > Disks and Partitions > <partition> > Space Available
- Metric Browser > Disks and Partitions > <partition> > Space Used
Linux includes a mechanism for reserving some disk space to ensure that the system remains functioning even if non-privileged users consume all other disk space. By default, these metrics do not include this reserved space. The total disk space reported by the agent might differ from the total disk space reported by the Linux df command or other sources.
To override this default, and to ensure that these metrics include this reserved space, run the agent with the following command-line argument:
-Dappdynamics.machine.agent.extensions.calcVolumeFreeAndUsedWithDfCommand=trueThis feature is supported for Linux versions of the Machine Agent only.
Configure Free/Used Memory Metric Collection on Linux
You can configure how the Machine Agent calculates the amount of free and used memory on Linux machines. By default, the agent calculates any slab-reclaimable memory as used (not free) memory.
To configure the agent to calculate slab-reclaimable memory as free (not used) memory, run Machine Agent with the following command-line argument:
-Dappdynamics.machine.agent.extensions.countSlabReclaimableAsFreeMem=true
This setting affects the following metrics:
- Memory Usage (in Server Dashboard)
- Memory Used %, Memory Used MB, Memory Free %, and Memory Free MB (in Metric Browser)
Viewing Server Visibility Metrics
You can only view Server Visibility metrics in the Server Visibility version of the Metric Browser. You see this when you access the Metric Browser from the Servers tab in the top navigation bar of the Controller UI.
Machine Agent Versus .NET Machine Agent
If a server has both Machine and .NET Agents installed, there may be differences in metric values reported by the Machine Agent and the .NET Agent due to different averaging rates and measurement methods. See .NET Compatibility Mode.
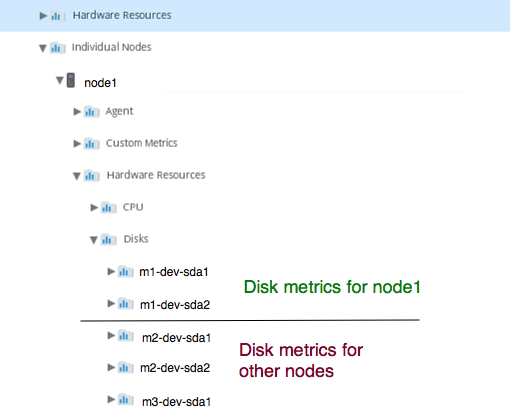
Streamlined Browsing Mode
The Server Metric Browser includes a Streamlined Browsing option for node metrics. Use this option to browse metrics for tiers that contain multiple nodes.
- With Streamlined Browsing enabled, each node in the browser tree view shows only metrics reported by the Machine Agent on the corresponding node.
- With Streamlined Browsing enabled, the Hardware Resources and Custom Metrics folders do not display.
- With Streamlined Browsing disabled, each node in the browser tree view also shows metrics for other nodes in the same tier (with no indication of the node that corresponds to which tier group).
This streamlining option is not enabled by default. AppDynamics recommends that you enable this option. To enable this option, go to:
http://<controller host>:<port>/controller/admin.jsp and set sim.metrics.metricBrowser.machineMetricMappings.enabled to true.
Streamlined Browsing Enabled | Streamlined Browsing Disabled |
|---|---|
|
|

Linux Kernel Processes
The Machine Agent has a processSelectorRegex setting that specifies the set of processes monitored by the agent. The default regex filters out most kernel processes on Linux machines. The agent considers monitored processes only when it calculates CPU, Memory, and Process metrics. These metrics may differ from metrics reported by other sources such as Linux commands.
Default Monitoring Mode
The Default Monitoring Mode column indicates the default category of each metric when Dynamic Monitoring Mode (DMM) is enabled. When this mode is enabled, a Machine Agent reports metrics based on the DMM setting on that server:
- KPI – Report Key Performance Indicator metrics only
- Diagnostic – Report KPI and Diagnostic metrics
- Advanced – Report all unfiltered metrics on the Machine Agent.
Load Average Percentages are Scaled by 100 in the Metric Browser
Load Average metrics are shown as float values (such as 0.70 or 1.05) in the Server Dashboard. In the Metric Browser, these metrics are multiplied by 100 to provide two decimal points of precision. If a server has an average load of 7.67, for example, the Server Dashboard shows the Load Average as 7.67 and the Metric Browser shows the Load as 767. To use one of the metrics in a health rule or custom dashboard, divide the metric by 100.
Stolen Times are Reported Differently
On Windows Machine Agents, if CPU %Stolen is not matching values reported by AppDynamics, it may be because Windows Performance Monitor's (Perfmon) counters operate at a granularity of 100ns for CPU metrics. For CPU %Stolen, the counters are provided by the Hypervisor, which operates on a granularity of 1ms. Windows Perfmon divides the CPU %Stolen counter (operating on 1ms) directly by time (in units of 100ns), which results in the CPU %Stolen values being reported at a very low percentage (~0.01%).
AppDynamics makes the correction between different units of time, which is why values reported by AppDynamics are greater than Perfmon's values by a factor of 10,000 (time in 1ms * 10,000 = time in 100ns). CPU %Stolen values reported by AppDynamics sometimes exceed 100% under high load. These CPU %Stolen values are a result of multiple cores being used by the guest machine, where %Stolen time is added across multiple cores.
To compute the %Stolen time:
- On a PowerShell terminal in the monitored guest machine, run
Get-WmiObject Win32_PerfRawData_vmGuestLib_VCPU. - Note the CpuStolenMs counter (in ms).
- Note the Timestamp_PerfTime counter (in ms, take a look at Frequency_Perftime, this value should be 1000 (in hz)).
- After a minute, run
Get-WmiObject Win32_PerfRawData_vmGuestLib_VCPUagain and take note of both the counters once more. - CPU %Stolen = 100% * (CpuStolenMS (at T2) - CpuStolenMs (at T1) / (Timestamp_PerfTime (T2) - Timestamp_PerfTime (T1)).
HardwareMonitor and JavaHardwareMonitor Calculate "Writes/Sec" Differently on AIX Machines
The Machine Agent calculates the Disk metric writes/sec on AIX machines differently, depending on whether the HardwareMonitor or the JavaHardwareMonitor extension is used. These extensions assume different block sizes when calculating these metrics. For HardwareMonitor, the block size is 4096 bytes. For JavaHardwareMonitor (based on SIGAR), the block size is 512 bytes. Because the number of writes/sec is calculated as <kb_written>/<block_size>, the HardwareMonitor results are lower than those calculated by JavaHardwareMonitor.