Download PDF
Download page Synthetic Sessions.
Synthetic Sessions
You use the Session page to analyze synthetic sessions. A synthetic session is a record of the complete sequence of events that make up one synthetic test. A session can cover one page or, in the case of scripted jobs, can extend to multiple pages. All session timestamps are in local time, regardless of the configured scheduled job's timezone.
A session begins at the first navigation start in the sequence and continues until the last page is fully loaded. In the case of single-page sessions, the session begins and ends when the page is fully loaded (the session duration represented by the metric Visually Complete). Like Browser RUM Analyze and Network Request Analyze, the Synthetic Sessions view enables you to analyze results from all synthetic sessions.
For single-page applications (SPAs), sessions will include the base page and its virtual pages as one page: the base page.
Session Status
Sessions can have one of four statuses:
OK: The test ran successfully and returned data.WARNING: The test ran successfully, but there were inaccessible resources.BROKEN: Your job has an error. You can find the error in the script console output.- In single URL jobs, the test received a 4xx response.
- In scripted jobs, your script threw an uncaught exception. This can, for example, happen if you try to perform an action, like a click, on an element which is not on the page you are testing.
FAILED: The synthetic test has detected a problem with your site. When failed jobs have the statusFAILED, an event is created and the job is run again to confirm there was an error.- In single URL jobs, one of the following occurred:
- the browser couldn't reach the URL
- the browser received a 5xx response
- the session timed out
- In scripted jobs, your script had an assertion failure or timed out.
- In single URL jobs, one of the following occurred:
Session UI
Records
The Records tab enables you to scan individual requests and allows you to filter and sort to get exactly the data set in which you are interested.

The values of Session Visual Time and Duration may not match. This can happen because Session Visual Time is the average of visually complete time, and Duration is the aggregate of the page load time.
Metric definitions:
- Session Visual Time: the average of visually complete time of all pages in the job.
- Visually Complete: Visually Complete time on a page is the point in time when the browser has finished rendering viewable content as compared to the entire content of the page.
- Duration: Duration or Session Duration is the aggregate of the page load time of all pages in a job and the time taken by any other execution logic in the script.
- Page load time: the time taken to download and display the entire content of a page in the browser window.
Session Details
Select a specific session and click View Details to see detailed information, including a page load waterfall and tabular details for resources. In multi-page sessions, the left navigation allows you to select each page from the sequence.

Business Transactions
When a business and a browser application have correlated business transactions, you can also create synthetic jobs from that browser application that makes requests to the business application to get business transactions in synthetic sessions. You can view business transactions in the Waterfall and the Business Transactions tabs of the Session Details dialog.
If you see ![]() View Snapshot > next to resource in the waterfall, that indicates that there was a correlated business transaction. Clicking it will take you to the business transaction snapshot from the backend.
View Snapshot > next to resource in the waterfall, that indicates that there was a correlated business transaction. Clicking it will take you to the business transaction snapshot from the backend.
You can also click the Business Transactions tab to see a list of the server-side business transactions this request initiated. Click through to the related Business Transaction dashboards.
Script Output
If you used a script, you can click through to see any script output.

Click Copy to Clipboard to copy the script output to your clipboard or Download to download the script output.
Session Screenshots
Synthetic captures screenshots of the browser as your job runs. By default, it takes one screenshot per page, when the page is finished rendering. Screenshots are retained for 30 days.
In scripted jobs, you can call an API from your script to take a maximum of 10 screenshots per page. The screenshot will be of the visibly complete content in the viewport (won't include the browser chrome).
The Screenshots tab shown below displays the screenshot as a 200 x 150 image. The resolution of the screenshot will be the same as the device where the screenshot was taken.
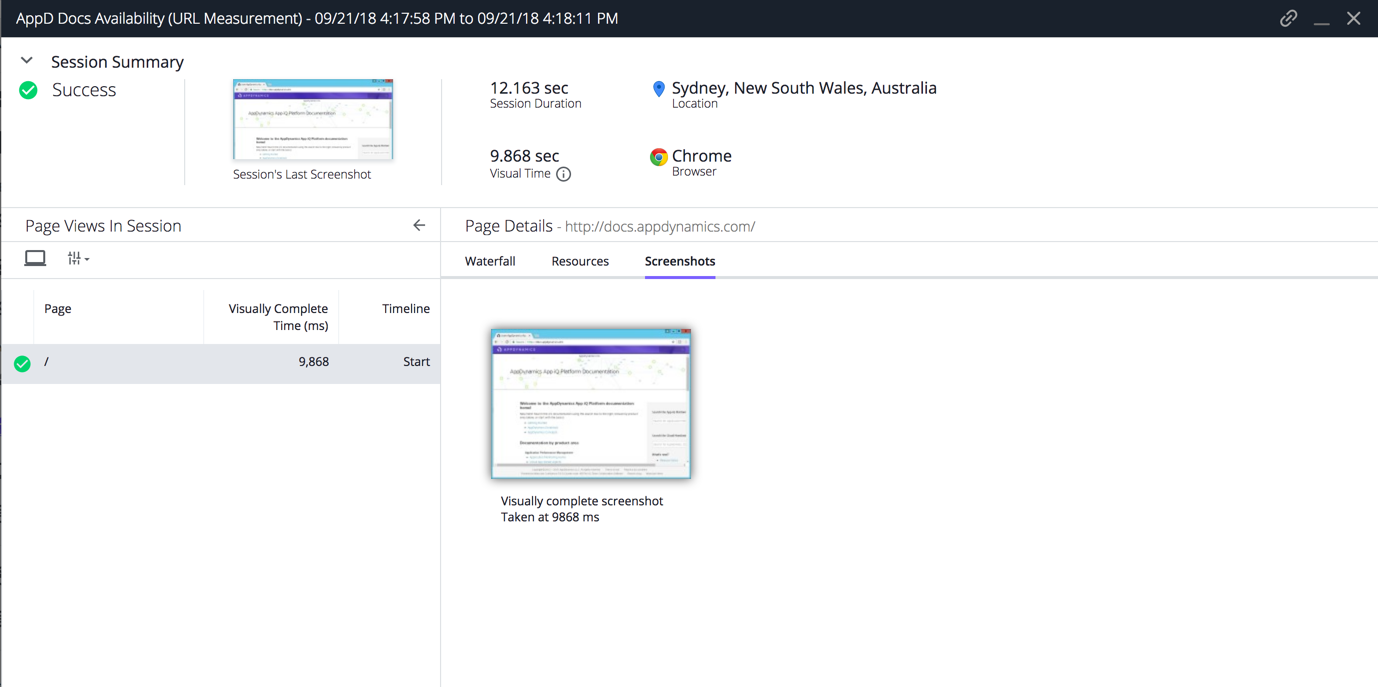
The Waterfall tab will contain the visually complete screenshot and any custom screenshots (e.g., screenshot2 in the screenshot below) triggered by the script.
Charts
The Charts tab provides you with a set of widgets that offer predefined visualizations of the data set you have created, allowing you to create a dashboard. You can delete, re-add, resize, and drag-and-drop to move the widgets.

Analyze Session Results
You understand the results of your synthetic jobs through sessions. From session details, you can determine if there were errors, what type of errors, and diagnose what factors are affecting performance. The following sections show you how to analyze synthetic session results for errors and performance issues.
Errors
Determine Type of Error
At this time, you should be able to determine the type of error by the Status and Error Type fields. The session status indicates whether your jobs are passing, failing (there is a problem with the system being tested), or broken (there is a problem with the job itself). The Error Type field gives more information about the cause of the error.
Understand the Error
- From the Sessions > Records tab, select a session with an error and click View Details.
- From the Session Details dialog, you can view when the error occurred and the returned error message in the Waterfall tab.
- If your job used a custom script, you can click Show Script Output to view the script results. You can download or copy the results as well.
- You can also view the screenshot to see how the error might be manifested to end users. You might want to display the errors in a more user-friendly way and possibly omit error details.
Performance
One of the best ways to see if your job is having performance issues is to view widgets representing aggregated metrics in the Charts tab. With a quick glance, you can see if there are site availability issues, where end users might be having bad user experiences, how long sessions are lasting, and how long it's taking for pages to be visually complete.
Network Latency
The Waterfall tab shows you a timeline of when resources are loaded and plots the events First Byte, DOM Ready, Load Event, and Visually Complete that mark significant and discreet moments from the time the browser receives data until the user can see a complete page.
To understand session performance, you can compare the end user response time (the same as the onload time) of a page with the session duration. This gives you an idea of which pages are taking too long to load and how that might be affecting the session.
You can also click one of the bars to determine if a resource is taking a long time to load. For example, if an image is taking too long to load, you can take actions to optimize the loading time such as caching the image, reducing its size, confirm that the image is the size that you’re displaying it, or not use the image at all.
Problematic Resources
The Session Details dialog shows you the final session state and the session state set by each page. The final session state is indicated in the top-left corner, whereas, the session state set by each page is shown in the Page Views in Session sidebar. In the screenshot below, the  icon indicates that the first page set the session status to "Warning". From the Waterfall tab, you can also discover which resources didn't load, either marked in yellow for the "Warning" state or in red for the "Failed" state.
The Resources tab shows you the number of resources by category, the domains requested, and key performance metrics that you can use to sort the results. You can quickly identify resources that are slowing the page load and potential DNS problems.

You can also configure your synthetic jobs to check the availability of resources. You can set the session status to Failed or Warning when resources are unavailable. See Configure Availability Rules for configuration instructions. When the session status is set to Failed or Warning, Browser Synthetic Monitoring triggers corresponding events that can be used to create alerts. This enables you to be alerted when resources are missing. See Alerts for Browser Synthetic Monitoring to learn how to create availability policies.
View the Effects of Performance Issue
Screenshots will show you what your user is seeing. From the screenshot, you can determine whether the content has completely loaded (text, images, containers, UI components) and the page is styled correctly (CSS).
From the Waterfall tab, you can determine when the screenshot (visually complete) and view a small thumbnail by hovering over the camera icon.

By navigating to the Screenshots tab and double-clicking the screenshot, you can view a larger screenshot to see details such as the styling, UI components, and content.