Download PDF
Download page Search Analytics Data.
Search Analytics Data
You can search Analytics data in two modes:
- Basic mode, where you can add search criteria to filter your data and return a subset of available events. In Basic mode, you see the list of events that match your search criteria, along with a count of those events. This mode is referred to in the UI as Drag and Drop Search.
- Advanced Mode, where you can use the AppDynamics Query Language (ADQL). ADQL is a SQL-like query language that provides additional operators and functions to enable more complicated searches. This mode is referred to in the UI as Query Language Search.
For each mode, you see the analytics data sources that are licensed and enabled for your application. The applications, data sources, and other fields that you see depend on how the administrator has set the permissions for your role. When creating new roles, remember that granting permissions to view transaction analytics data does not automatically grant permissions to see all application data associated with a specific transaction analytics record. You need to grant at least read-only permissions to the application to enable the user to see associated transaction snapshot data such as flow maps.
Search Results Limits
Search results in the UI can return up to 1000 records. By default, each page displays 50 results at a time. In Advanced mode, you can explicitly set a LIMIT to see more than 50 results on a page. Setting a limit disables pagination and shows up to 1000 records on a single page. The total number of records for the query shows at the bottom right. The UI caps the number of search results at 1000 regardless of mode or the value of an explicit LIMIT. To return more than 1000 records, you must use the Analytics Events Query API.
See LIMIT Clause.
Exporting Analytics Data
Analytics allows you to export data to a file in CSV format for external use.
Before you export a set of data, consider these guidelines:
- The maximum number of records exported for a non-aggregation query is 65000. Use the LIMIT clause to restrict the records to a number below the upper bound. The LIMIT clause does not return any additional records that satisfy the export selection criteria.
- The number of records exported for an aggregation query by default is 10. If you want more than 10 records, use the LIMIT clause. You can export up to 1000 records by using the LIMIT clause.
- The CSV file format is RFC4180.
Response from all valid ADQL queries can be exported. The method of writing ADQL queries remains the same.
- Only the fields that you specify in the
SELECTclause export to the CSV file. ADQL query supersedes the Controller Tenant UI selection. The fields you select to display in the Data tab have no impact on the exported data even if the query includesSELECT *. - Fields having nested representation are flattened and appear as separate fields in the CSV file. Additionally, the corresponding unflattened nested fields also appear in the exported records. Flattening fields refers to separating nested fields into individual fields.
- The supported
DateTimeformat is ISO, yyyy-MM-dd’T’HH:mm:ssZZ, without the millisecond value. The timezone is local to the browser from which export is requested. A timestamp field in a nested field is converted to the local timezone only in the flattened fields, not in the unflattened nested field. The format in the UI, that isMM/DD/YYYY HH:MM:SSAM/PM,is different from the format that you see in the exported data. - The time required to export data varies with the record size you are trying to export. Exporting tends to slow down for a larger set of records because executing the query on and retrieving a large data set takes longer to complete.
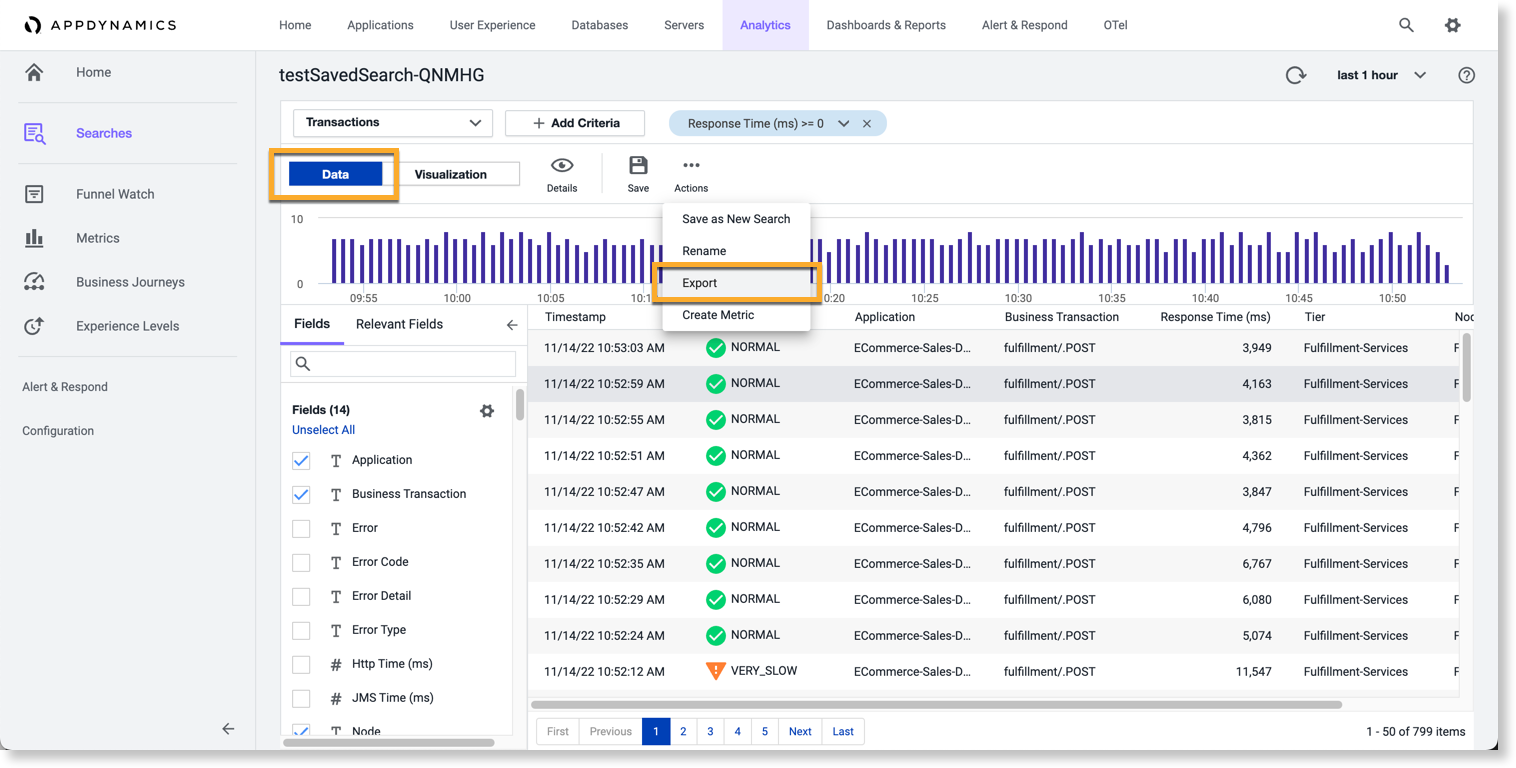
You can export metrics to the Metric Browser and search results from the Searches screen. Use the Export option under Actions on the toolbar to do so. While you are on the Searches panel, use the Data mode to export your search result.
Access the Analytics Search UI
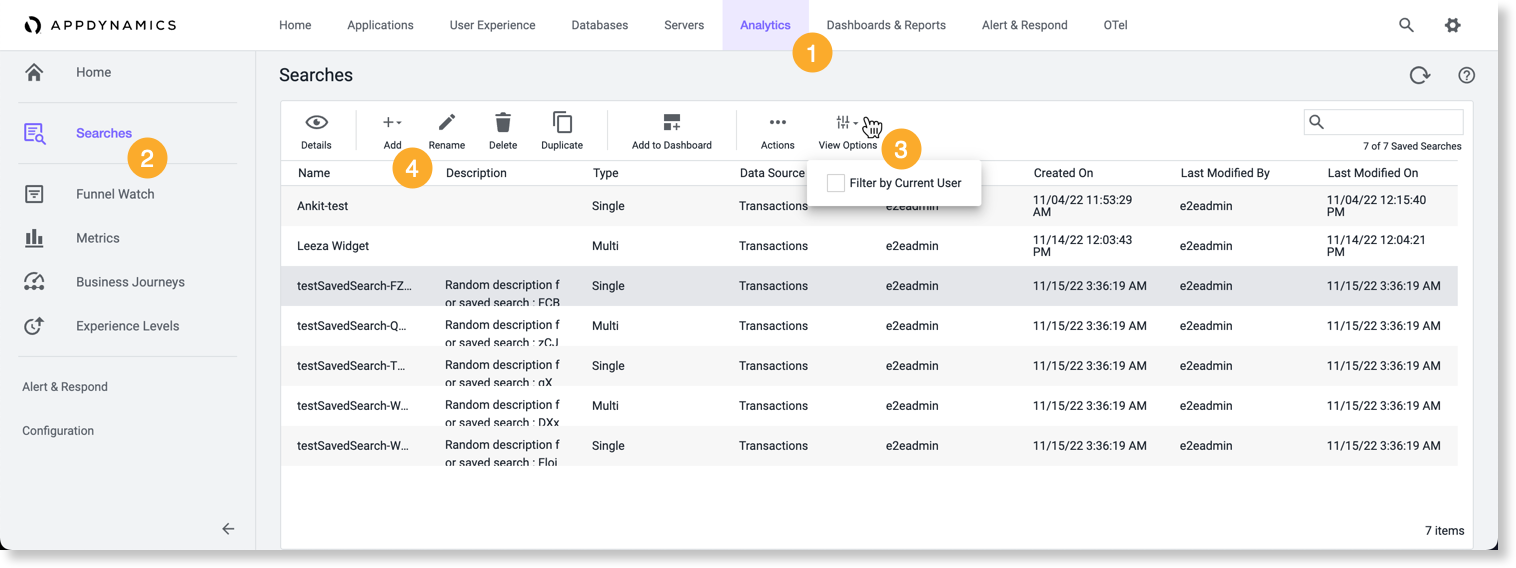
- Click Analytics
 or select a data source to view a default search for that event type.
 - Click Searches
 to create new or view saved searches.
 - Click View Options
 and select Filter by Current User to view your previously saved searches.
 - Click +Add
 to create a new search or select an existing search to activate the actions on the action toolbar. See Create Basic Analytics Searches or Create Advanced Analytics Searches.
There are two tabs that display search results.
- All event types share the same basic layout on the Data tab of the Search details page.
- Use the Data tab to search and filter the data that you want to review and analyze.
- Use the Visualization tab to create graphic representations based on that data.
- Search actions are available for each search. The actions vary according to the type of search and the tab you use. These actions are available:
- Rename
- Export (to CVS - only from the Data tab)
- Create Metric
- Add to Dashboard (only from the Visualization tab)
Basic and Advanced Search Comparison
This table provides a comparison of the functionality available in each search mode.
| Functionality | Basic | Advanced |
|---|---|---|
| Drag and drop fields to the criteria search bar | yes | no |
| Type-ahead (auto-complete) | N/A | yes |
| Visualization canvas widget support | multiple widgets | one widget per search query |
| Grouping of events with the GROUP BY keyword | yes | yes |
Wild cards with comma-separated text (Basic mode) or IN operator (Advanced mode) | no | no |
| Percentile Histogram widget | yes | no |