In the AppDynamics Controller UI, click
Analytics > Experience Level Management to view or export XLM data.
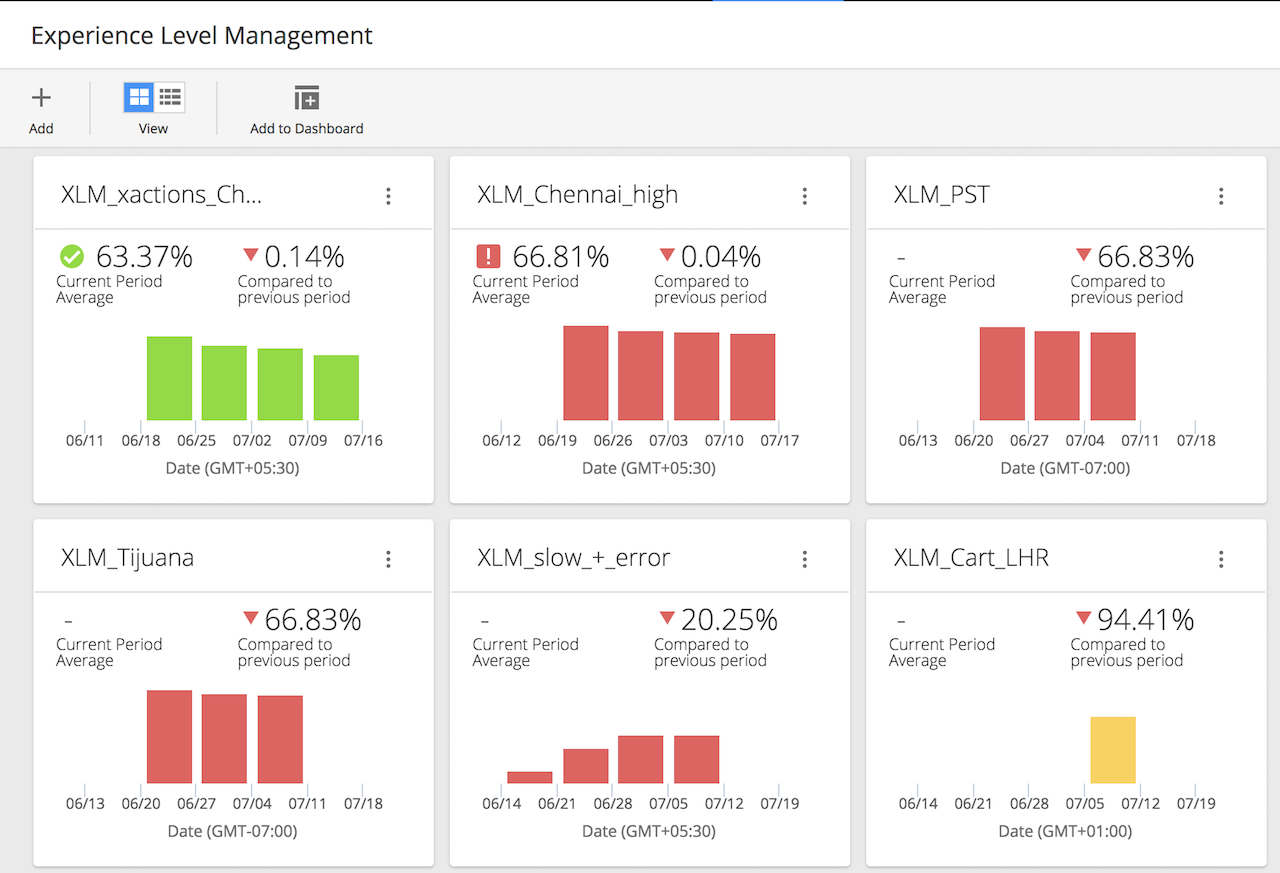
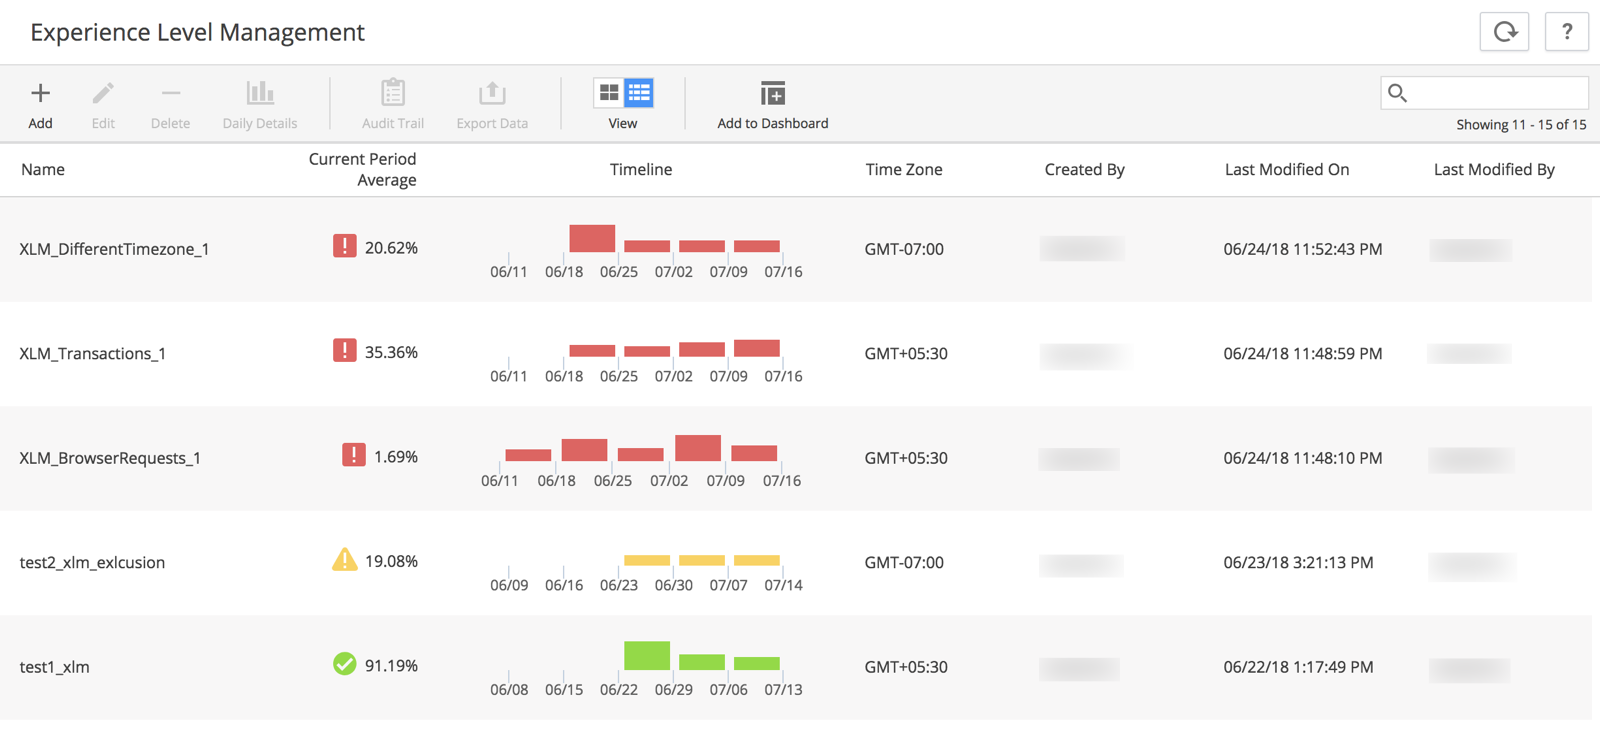
View XLM Data
You can view the last five reporting periods for your XLM data in a card or list view. To access data for earlier reporting periods, export the data as described below.
Timelines show dates in your local timezone and indicate how local time relates to Greenwich Mean Time. For example, if your local timezone is Pacific Standard Time, Date (GMT-7:00) appears beneath timelines.
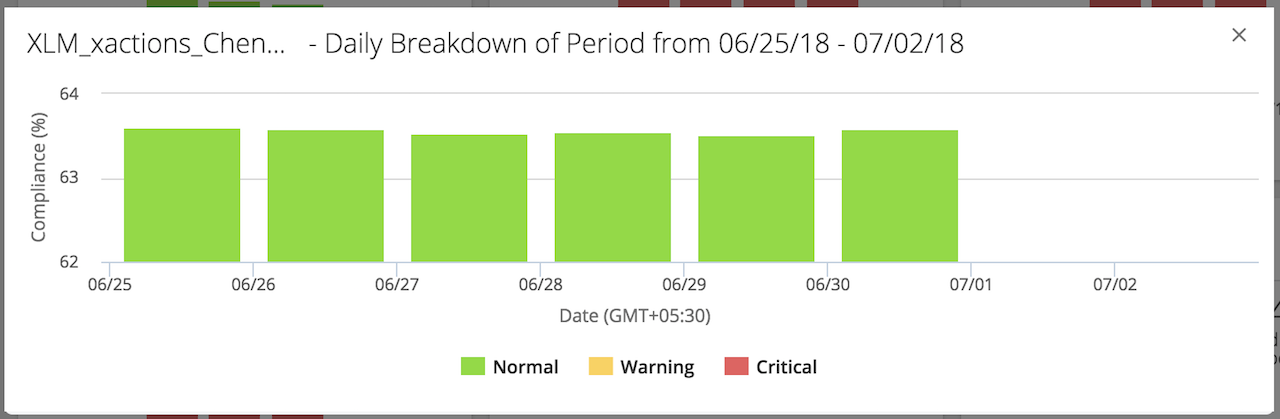
Both views enable you to drill down from multiple reporting periods, to days, to individual events.
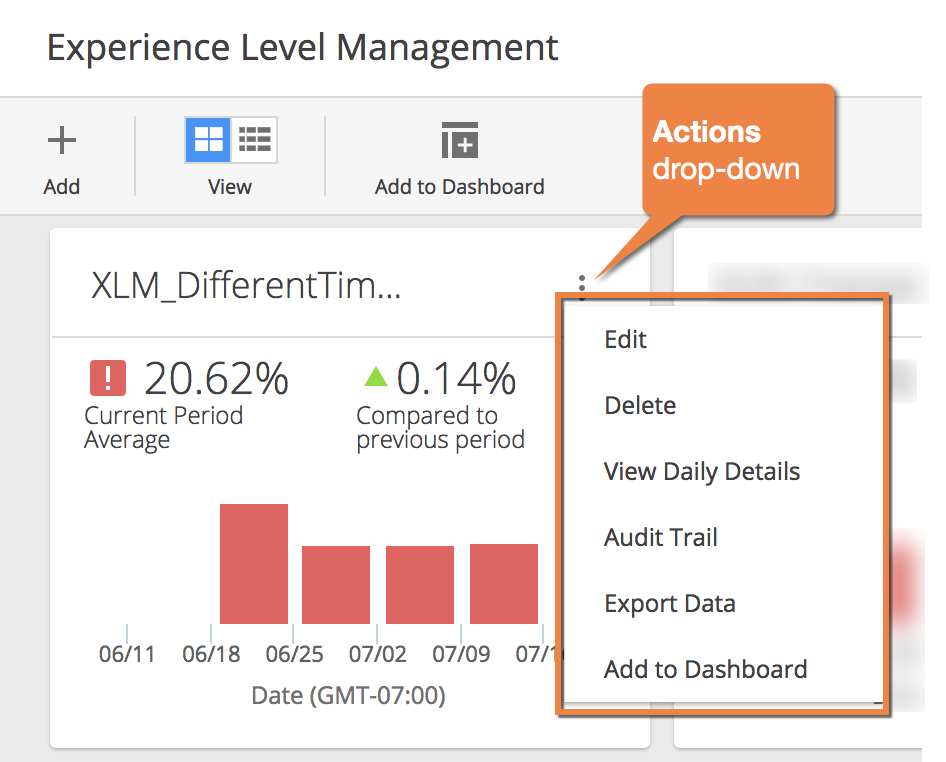
Card View
Click any reporting period for a daily breakdown.
Right-click any day to view associated events.
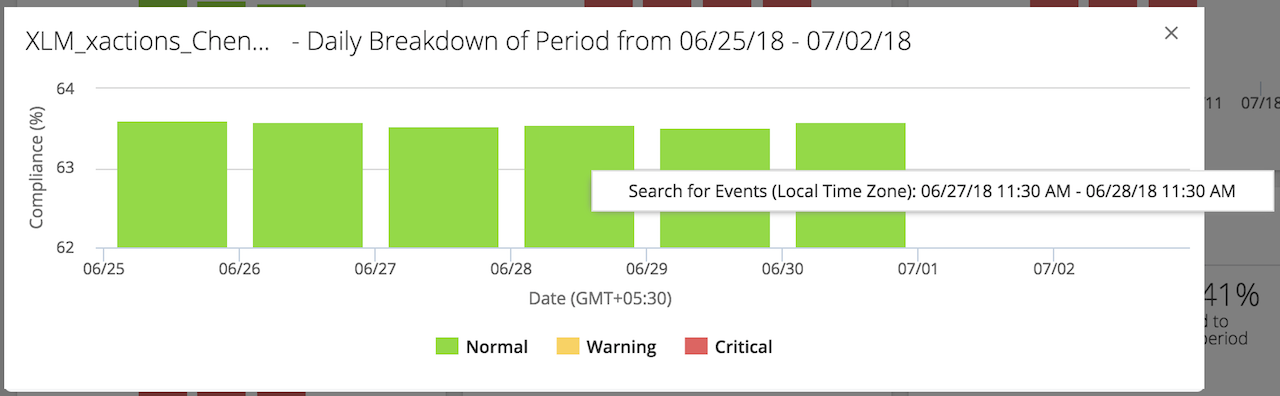
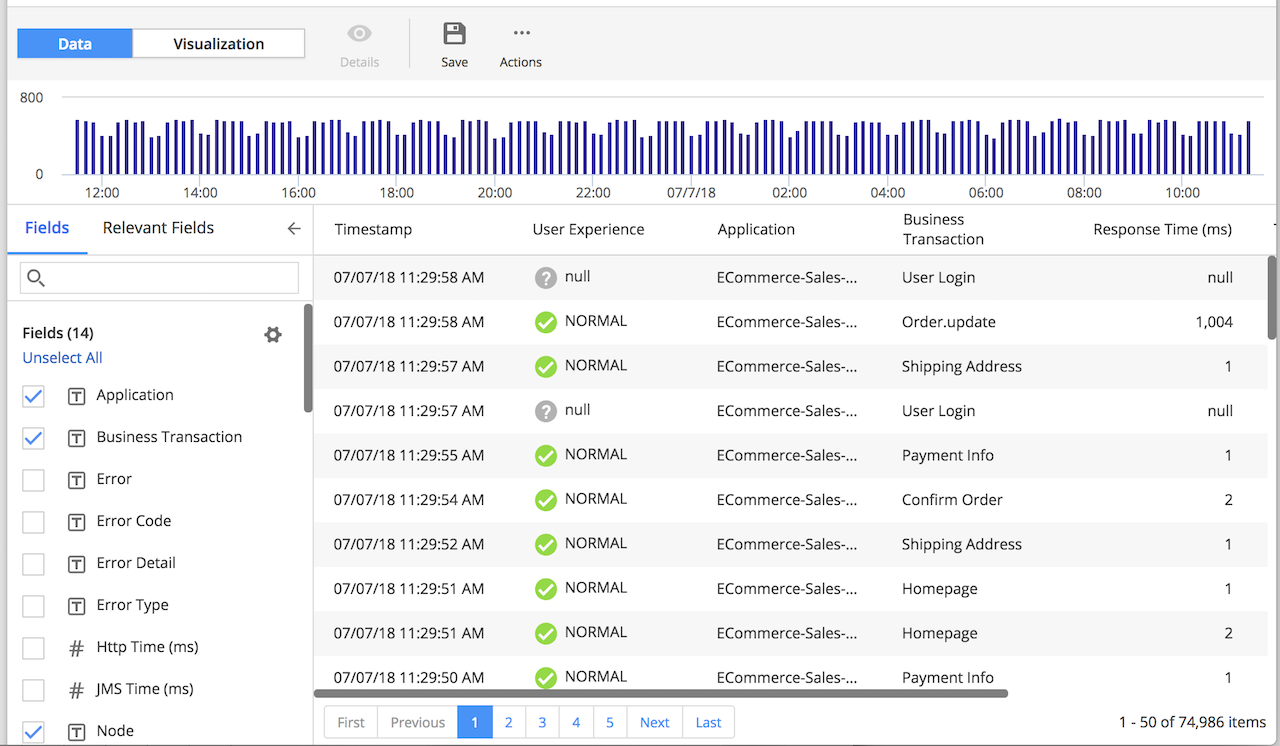
This brings you to an Analytics > Searches page where you can inspect the entire day's events.
List View
As in the card view, you can:
- Click any reporting period for a daily breakdown
- Right-click any day to view associated events
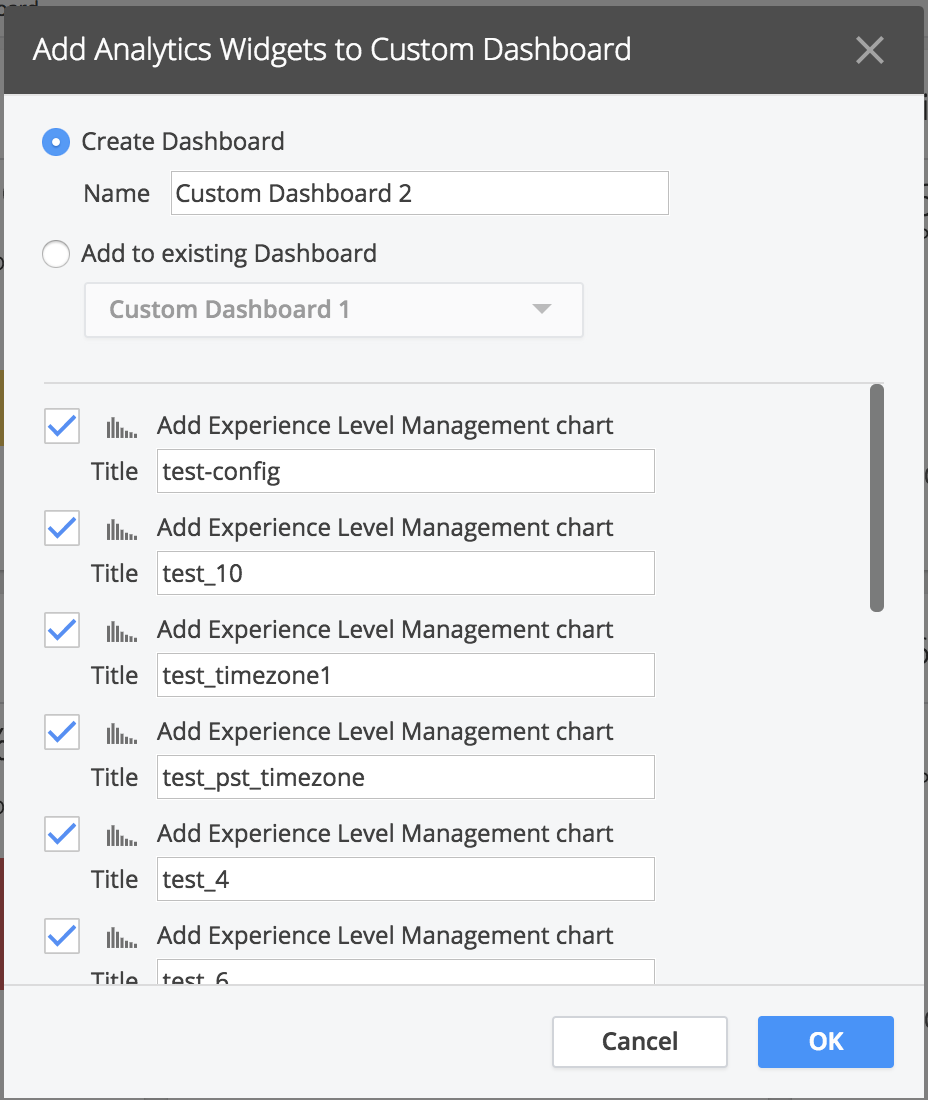
Add XLM Reports to Custom Dashboards
You can add XLM reports as read-only widgets to your custom dashboards:
- One at a time, from the Actions drop-down, or
- One or more at once, from Add to Dashboard in the Experience Level Management panel
From the Experience Level Management panel, click Add to Dashboard. Alternatively, click the Actions dropdown on an individual XLM report.
Export XLM Data
You can export XLM data using the Actions dropdown, which also offers additional views and actions.
You can export as many reporting periods as you wish. The export format is CSV.
The XLM export file shows the latest configuration along with compliance data.