Page snapshots give you a detailed look at individual browser page requests. The Summary tab covers the general characteristics of the page.
Waterfall Graph
The top of the page snapshot Summary tab displays a waterfall graph of the overall transaction timing for the page. You can hover over each of the metrics to see a popup definition for that metric.

For more information about metrics, see Browser RUM Metrics. Additional details associated with the snapshot, including any related snapshots and any custom user data, are displayed as a table below the graph.
Generate a Synthetic Snapshot - SaaS Only
Synthetic snapshots use geographically distributed agents to create snapshots of web page download performance without the idiosyncratic and potentially skewing effects of real-user, last-mile performance. Click Generate a Synthetic Snapshot to create an on-demand synthetic snapshot to compare with a problematic real user monitoring snapshot.
Correlated Transaction Snapshots and Business Transactions
If server-side correlation has been set up, a link to any related business transaction is shown:
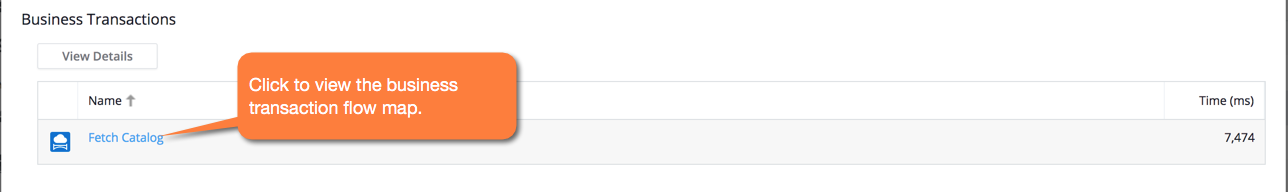
Clicking the link takes you to the flow map for that business transaction on the server side.
If the business transaction created a transaction snapshot, links to the business transaction, tier, and node flow maps are displayed, along with a direct link to the transaction snapshot flow map. Cross-app correlation is supported.
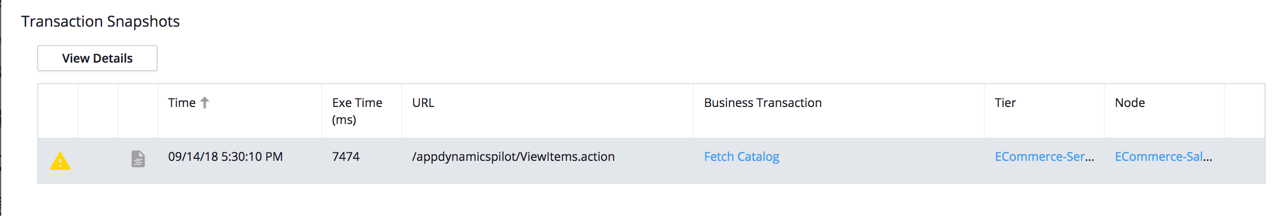
In this case, the transaction snapshot also has a link back to the browser snapshot.

JavaScript Errors
If there are JavaScript errors on the page, they are displayed below the waterfall graph.

You can configure to ignore errors if you are seeing too many irrelevant or excessive errors. See Configure JavaScript and Ajax Error Detection for instructions.
When an error occurs in a script that is hosted on a domain other than the domain of the current page, most browsers prevent the JavaScript Agent from recording any details of the error. In such cases, the string CROSSDOMAIN is displayed as the Script Origin.
User Data
If you have custom user data set up, the data appears in the Details section:

Resource Details
If the browser supports the Resource Timing API, the Resource Details tab gives you a detailed breakdown of the performance of resources—scripts, CSS files, fonts, SVGs, and images—as they are loaded into the page.

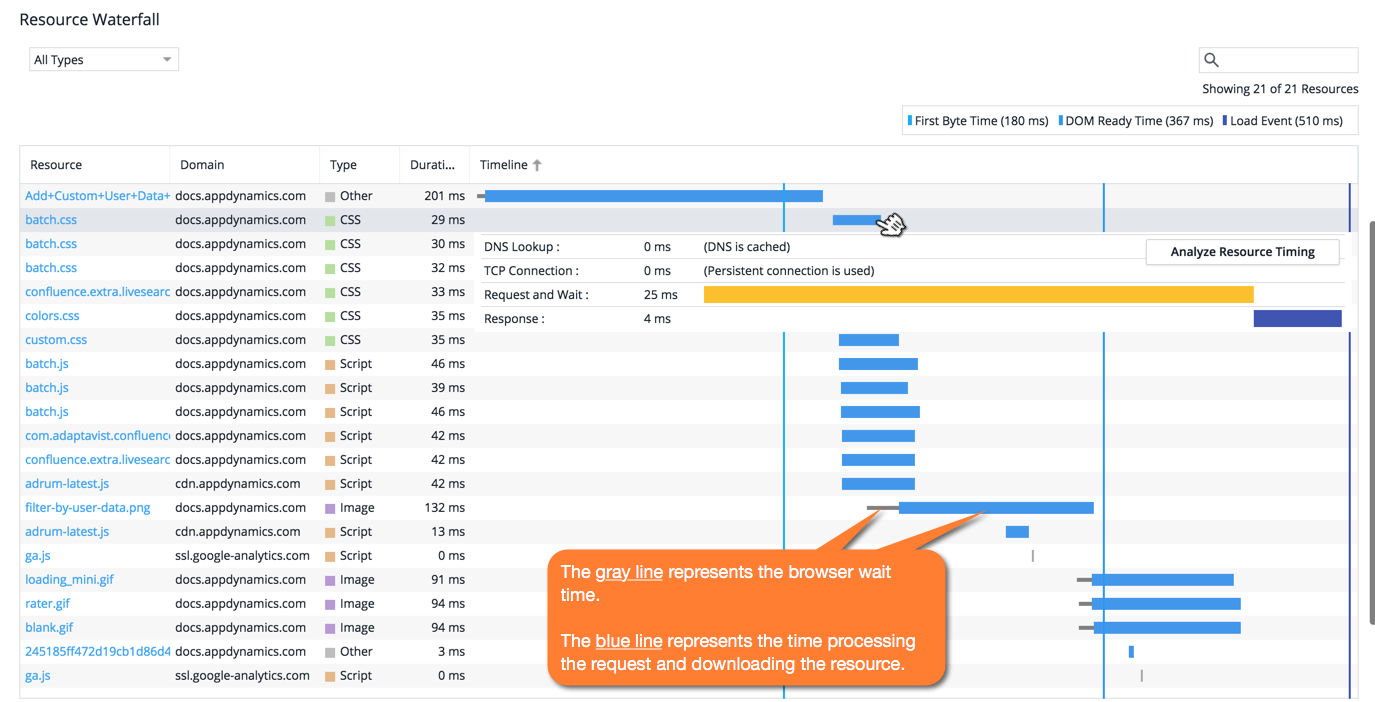
Resource Waterfall
The Resource Waterfall provides a snapshot of when each resource was loaded in the page load process (before First Byte Time, before DOM Ready Time, before Onload), including the name of the resource, the domain from which it was fetched, the type of resource, and how long it took. You can filter the items by type using the upper-right dropdown and search using the search box.
To see more details, click any of the blue timelines. These are from the primary domain or cross-domains that have set the Timing-Allow-Origin HTTP header. See Resource Timing Metrics for descriptions and explanations about how the metrics are calculated.
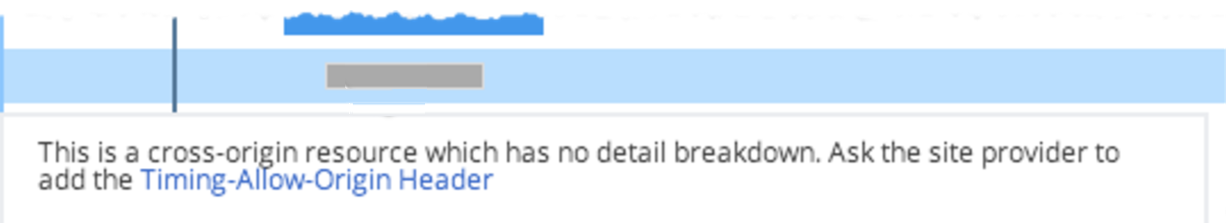
Grey timelines indicate cross-domains that have not set the Time-Allow-Origin HTTP header. Working with your CDN provider to add this header can mean you get better information on shared and CDN-served content.
Unknown Metrics in Page Snapshots
Browser RUM captures metrics using your end-users' web browsers. Occasionally, you may see unknown data reported for one or metrics in a browser snapshot. This occurs on older or less sophisticated browsers that do not support the collection of a given metric.
See Browser Monitoring Metrics for details about which metrics may not be captured based on browser capabilities.