Download PDF
Download page Manage Licenses.
Manage Licenses
Cisco Cloud Observability
Observability Platform Licensing
For customers starting Cisco Cloud Observability on June 28, 2023 or later, Cisco Cloud Observability is based on
Observability Platform tenant licensing, licensing for Cisco Cloud Observability, and Module licensing. See Cisco Observability Platform Licensing and Entitlements.
Token-based Ingestion
Cisco Cloud Observability uses a Token-based Ingestion model for customers who subscribed before June 28, 2023. With token-based ingestion, each license has a pool of tokens per license unit that allows you to monitor and consume licenses according to your data ingestion.
Cisco AppDynamics SaaS
Cisco AppDynamics SaaS uses both an Infrastructure-based Licensing (IBL) model and an Agent-based Licensing (ABL) model.

Navigation Overview
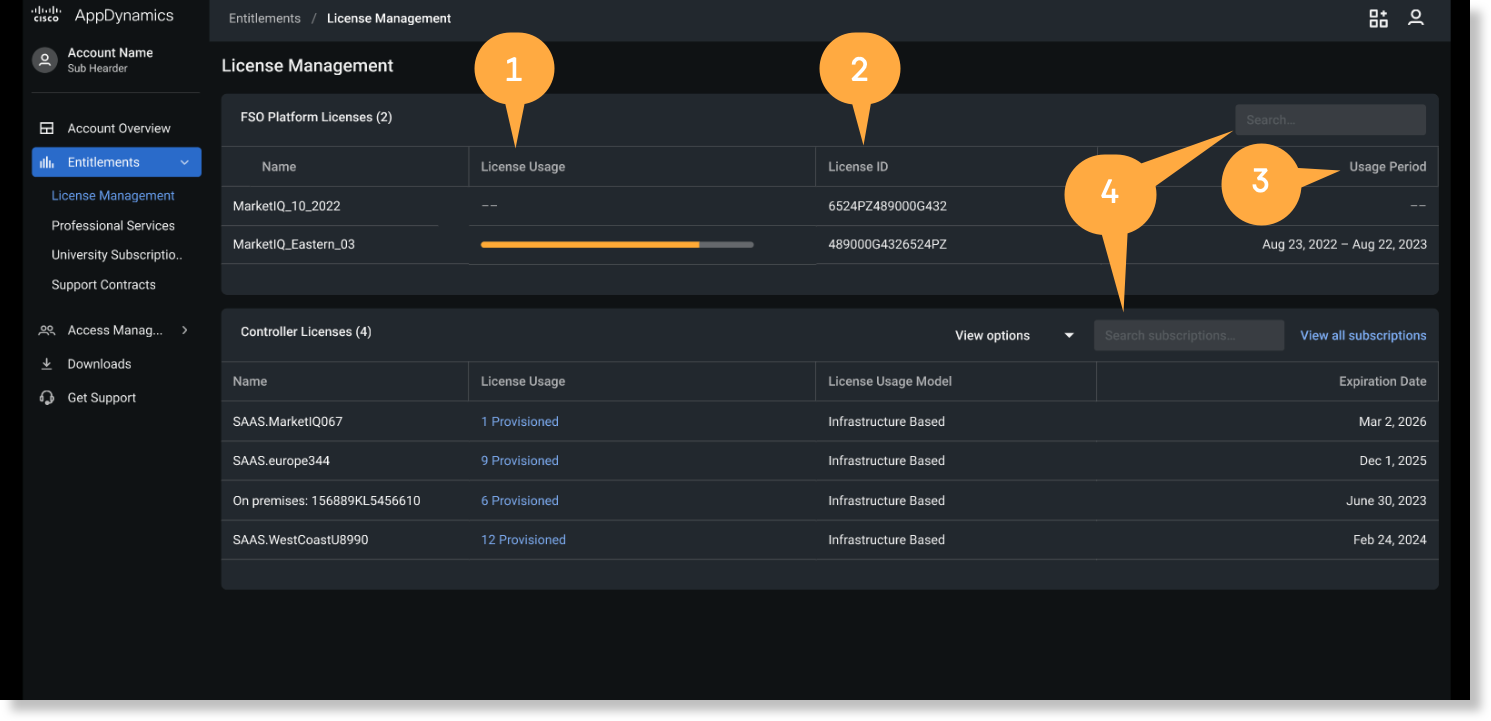
You can find license usage information by navigating to Entitlements > License Management. This page provides Observability Platform tenant-based and Controller-based license usage information for the current or specified usage cycle:
|
The UI provides a list of all the Observability Platform tenants associated with your account. You can hover over the Observability Platform tenant License Usage data to view the percent of total tokens spent for the usage period. Drill down into the Tenant for detailed usage information.
|
Access License Usage Detail
You can view the details of Observability Platform tenant or Controller Tenant license usage on individual Tenants. Cisco AppDynamics captures usage data in five-minute intervals and aggregates it into larger intervals.
The License Management Details page enables you view the breakdown of your Cisco Observability Platform license usage and monitor the usage over time.
To view the License Management Details page, click on a license from the License Management Overview page.
| The Current Usage Cycle The Current Ingestion |
The Current License Usage At the beginning of each calendar month, the license usage resets to 0. The license usage is determined by the number of Observability Platform tenants, application, and module licenses that you purchased. See Cisco Observability Platform Licensing and Entitlements for details. The License Usage The Projected month-end consumption | |

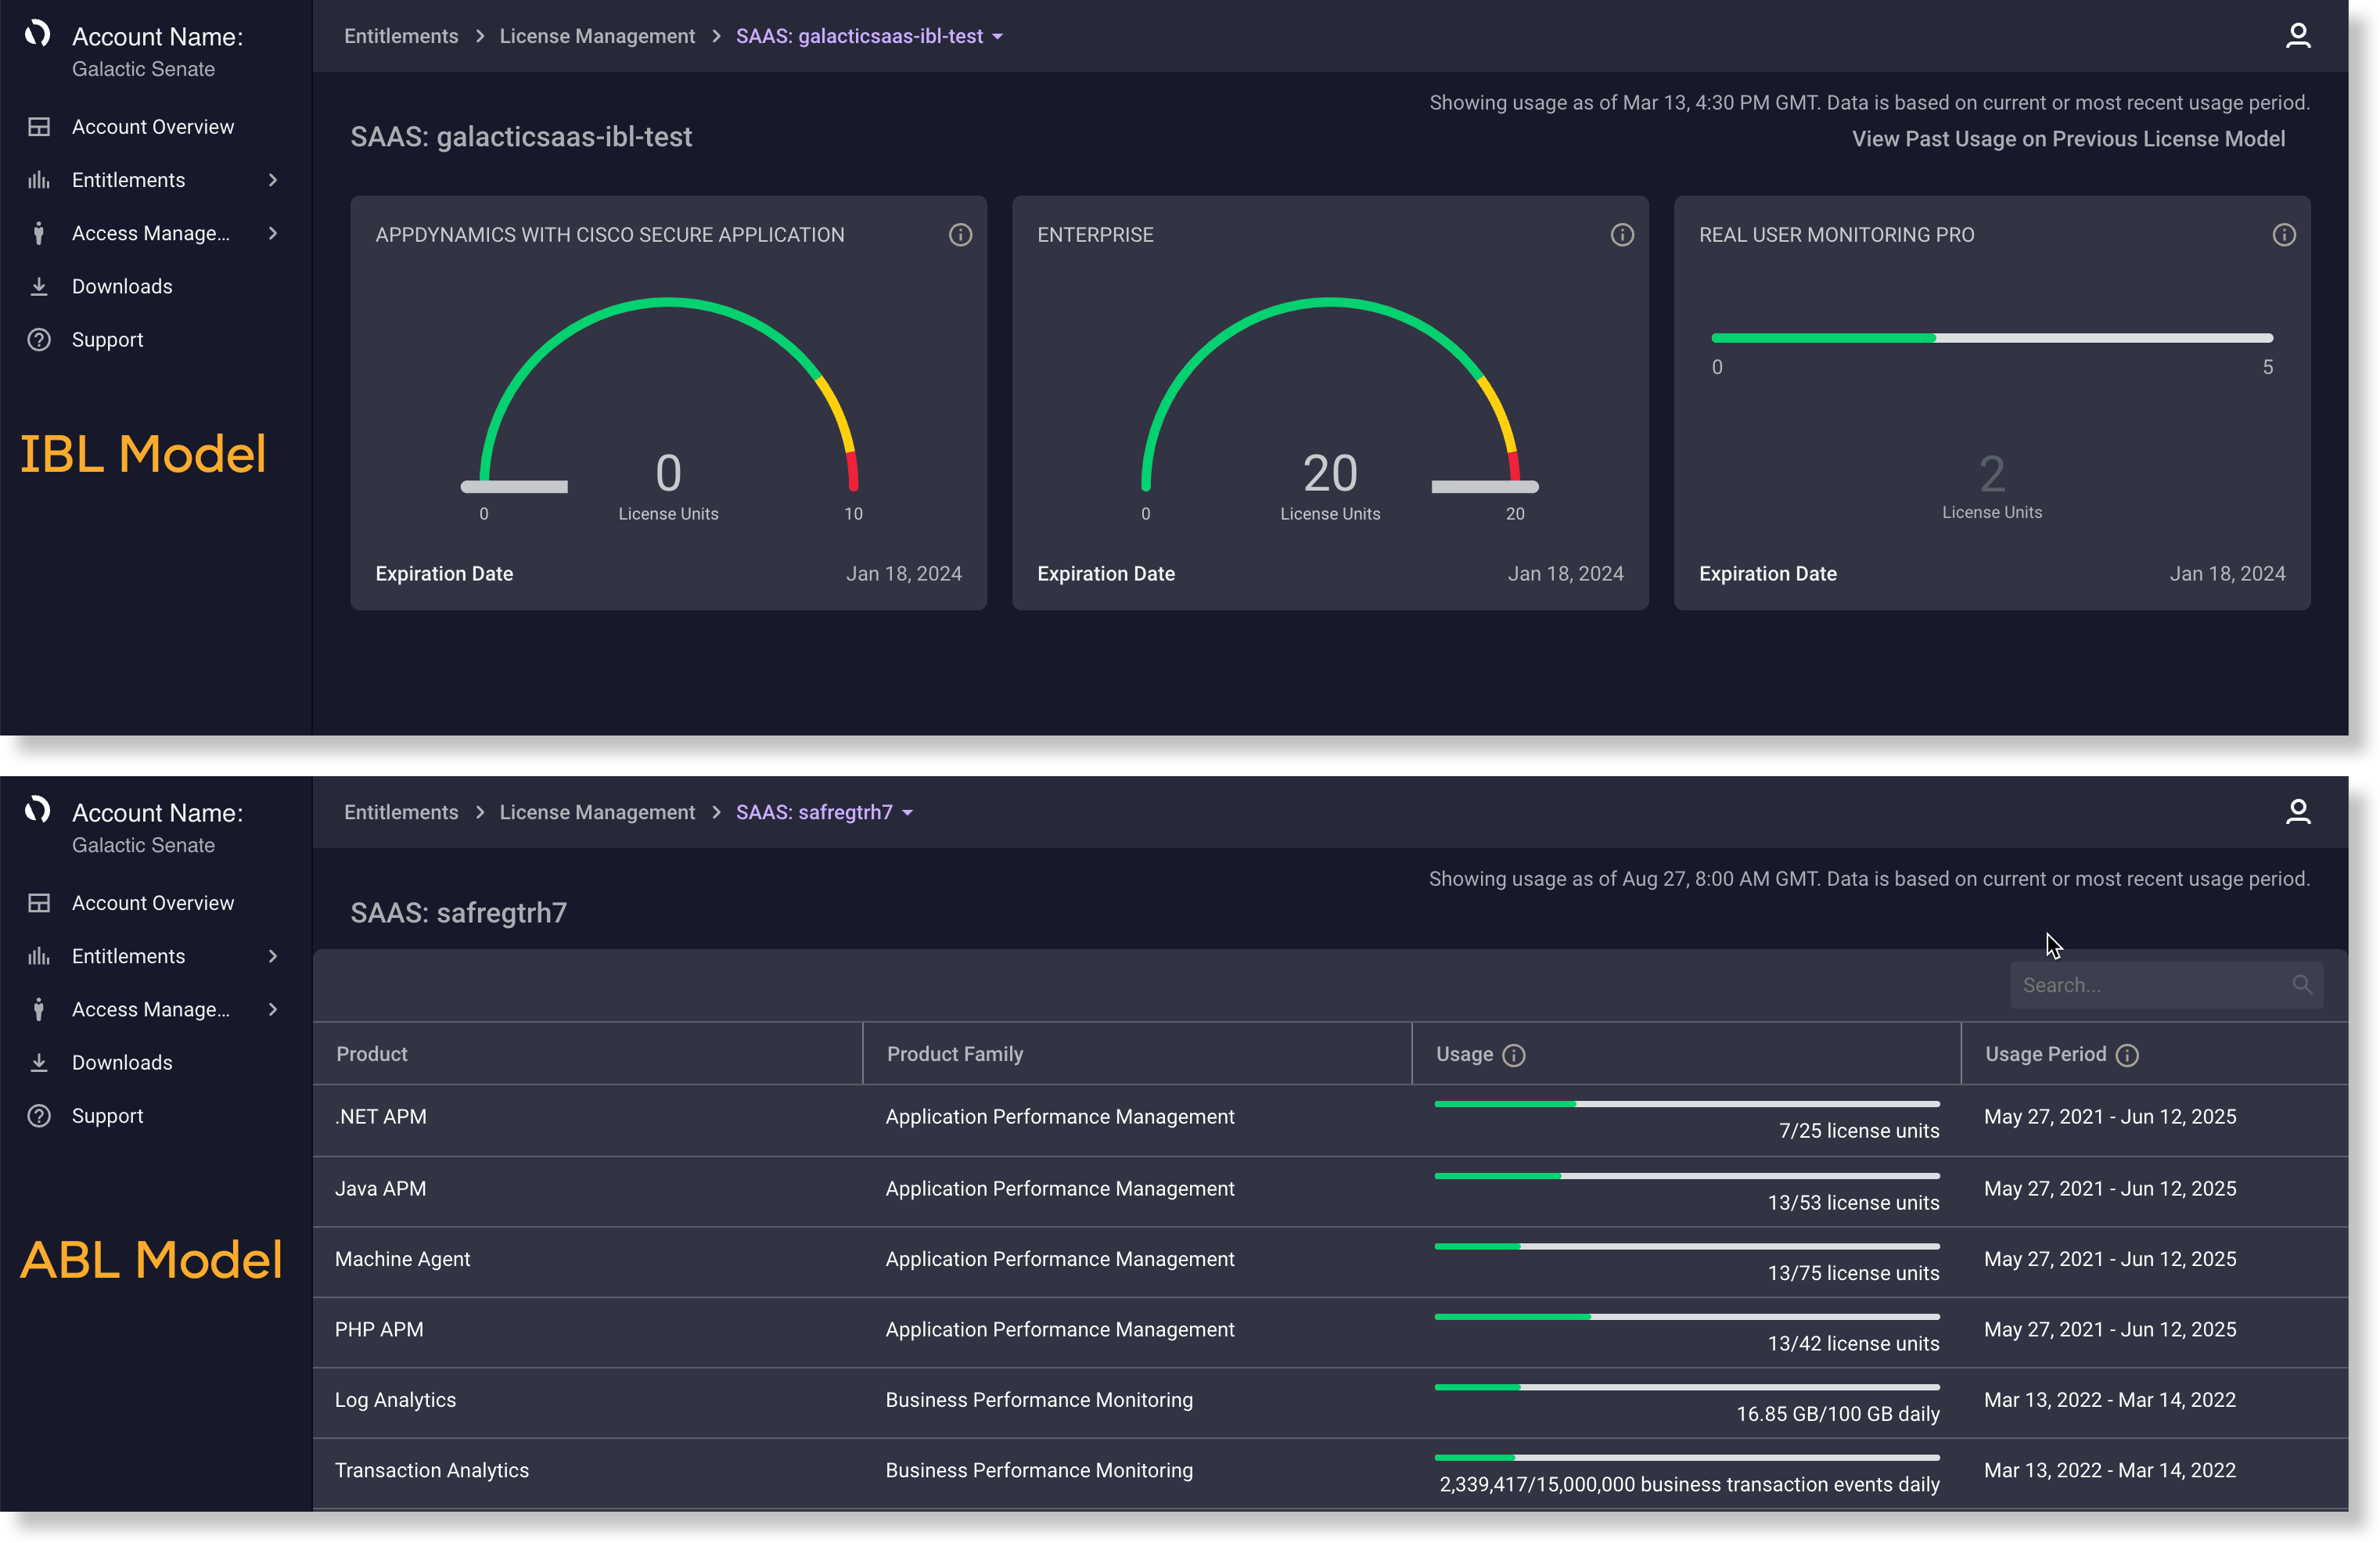
Each subscription license model has a unique display in the UI.
The IBL model offers license packages for Application Performance Management (APM), End User Monitoring (EUM), Application Analytics, and security. Each package includes a combination of Cisco AppDynamics Agents and is based on a single metering unit: CPU Core.
If you purchased Cisco AppDynamics licenses before February 23, 2021, you most likely have licenses in the ABL model. Agent-based Licensing is the original model in which each Cisco AppDynamics Agent is licensed and metered individually.
You can use View Options![]() to select a Controller type and status to filter the list.
to select a Controller type and status to filter the list.
There are several product families and each family has several products associated with it. Usage is measured differently for each product.
- Select a Subscription to access usage detail for each product associated with the license, including:
- Each Product associated with the selected license.
- The Product Family category.
- The current Usage of the product for a specified usage period.
- The Usage Period in which the product can consume licenses before the usage limit is reset.
The usage periods that display for each product in the detailed usage graphs are set as default time ranges for efficient page loading.
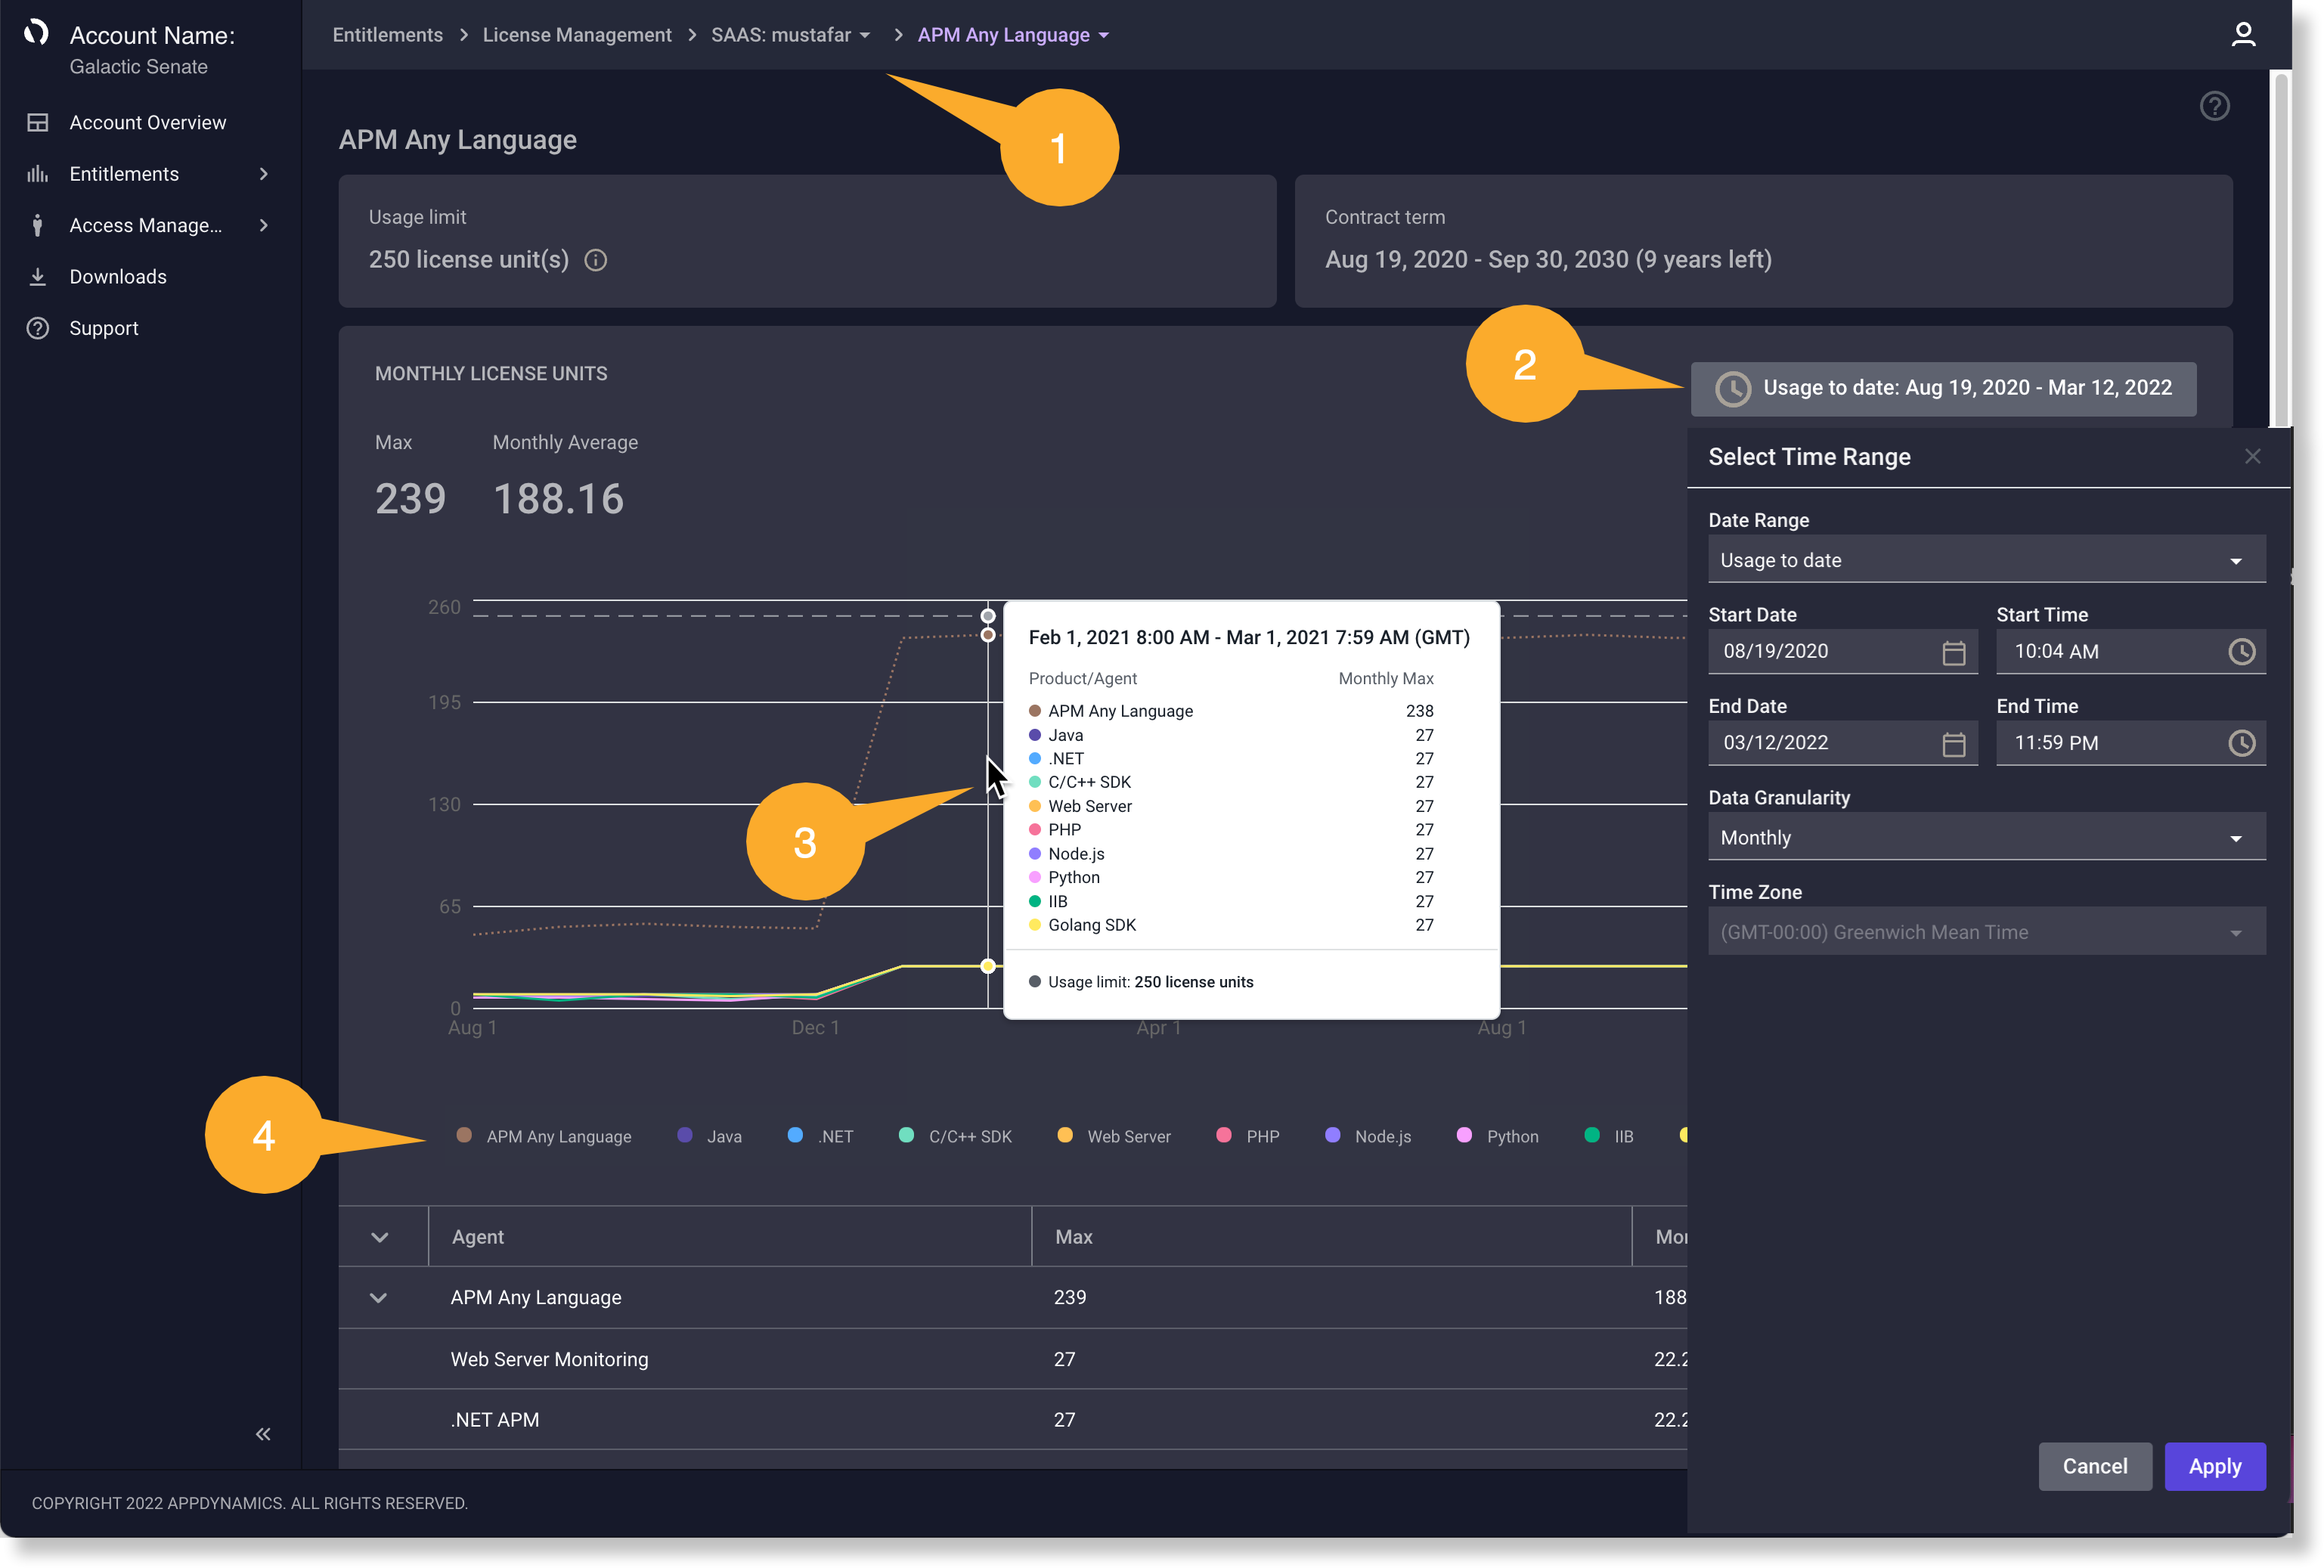
- Select a Product to view:
- The Usage limit.
- The Contract term.
- The Max and Monthly Average usage metrics.
- Total (cumulative) license usage for that product and product family.
For the APM Any Language product, select or deselect the language to view or remove usage data in the graph.
- Click one of the
 in the page navigation path
 to select a different license or different product within that license.
Only products associated with the chosen license display in the dropdown menu. - Click
 to use the Time Range Selector
 to adjust the period, date, time zone, and granularity of data you want to view in the graph. There are several predefined time ranges that allow you to view past cycles quickly.
- Select Data Granularity to choose daily, hourly, weekly, or monthly detail.
- Use the calendar and time tools to set specific historical ranges.
If you select a timeframe that is too long for the aggregation, certain granularity options are not visible.
For example, if you choose a timeframe longer than one month, hourly granularity is disabled. - Select Custom to view the timeline over several usage cycles.
- Select Data Granularity
- For certain ABL model products under the Application Performance Management (APM) and End User Monitoring product families, there are two graph types.
You can specify the data granularity and timeframe you want to view in both types.- A cumulative plot line graph for a given usage cycle.
- A non-cumulative plot line graph for the same usage cycle.
- Click
 or
or  to toggle the data display as either a line graph or bar graph.
- Hover over a data point on the graph to view granular metrics
 .
.
If you set a timeframe to less than one month, hourly metrics are available. If you select a timeframe greater than or equal to one month, daily data is available. - Click an agent name in the legend
 to include or exclude the metric on the graph.
 - When available, select View usage as <metered units> or View usage as license units.
- Viewing usage by metered units displays consumption according to how many events you consumed due to license unit consumption.
Each product has distinct meters on which licenses are consumed. Viewing usage by license units displays how many licenses have been consumed.
The usage data is the same; the x-axis displays the same usage on both graphs, while the y-axis reflects the view you select.
License units are always rounded up to the next highest integer because that is the minimum amount you would need for your monitoring.
- Viewing usage by metered units displays consumption according to how many events you consumed due to license unit consumption.
Max and Average Usage Metrics
You can view these metrics reporting for the timeframe you chose in the date range selector UI:
- Max—the maximum usage of all agents aggregated over the chosen timeframe. It is the maximum of all the data points on the graph.
- Monthly Average—the average of all agents reporting usage during the chosen timeframe. It is the average of all the average values on the graph.
For certain products under the Application Performance Management (APM) and Infrastructure Visibility product families, the x-axis is the time frame and the y-axis is the number of license units used.
The APM Any Language product includes multiple agents. Click a corresponding checkbox in the filter bar to drill down into usage for a particular agent (such as Java). Agents that do not report data during the selected timeframe are grayed out in the filter.
You can interpret metrics according to the view:
- When you select all agent types, the maximums and the averages of all agents display reporting usage over the selected timeframe.
- When you select one agent type, the results are restricted to that agent’s data.
- When you select a subset of agent types, the maximums and averages are calculated based only on the agents chosen.
Cumulative Plot Graph
This graph displays the total number of units used during either a usage cycle or a timeframe you choose.
- The y-axis represents the units used, either as the metered unit or as license units.
- The x-axis represents the time period.
For a given usage period, the Usage Overview will show usage as a percentage to display the quantity consumption against your total allocation.
Real User Monitoring, Synthetics Monitoring, and Transaction Analytics are a few examples of products that are metered on a cumulative basis.
Non-Cumulative Plot Graph
This graph plots the usage for a product’s given usage cycle or timeframe and the granularity you select. You can use the non-cumulative graph to help you determine how much of the product is being used at a regular cadence and whether there are spikes in usage.
Hover over a data point on the graph to view granular metrics. You can also view an average data point for the set granularity.
APM Any Language, Server Visibility, and Databases Monitoring are a few examples of products that are metered on a non-cumulative basis.
The license usage details help you gauge how your application is ingesting data. You can use this information to accurately determine how many license units you typically consume or how many additional tokens you may need during a given 12-month anniversary period.
To access usage detail:
- Select a Tenant Name.
- Review the following details:
- Token Pool—displays the number of tokens consumed from the total number acquired.
- Average Daily Token Use—displays a daily average of token usage.
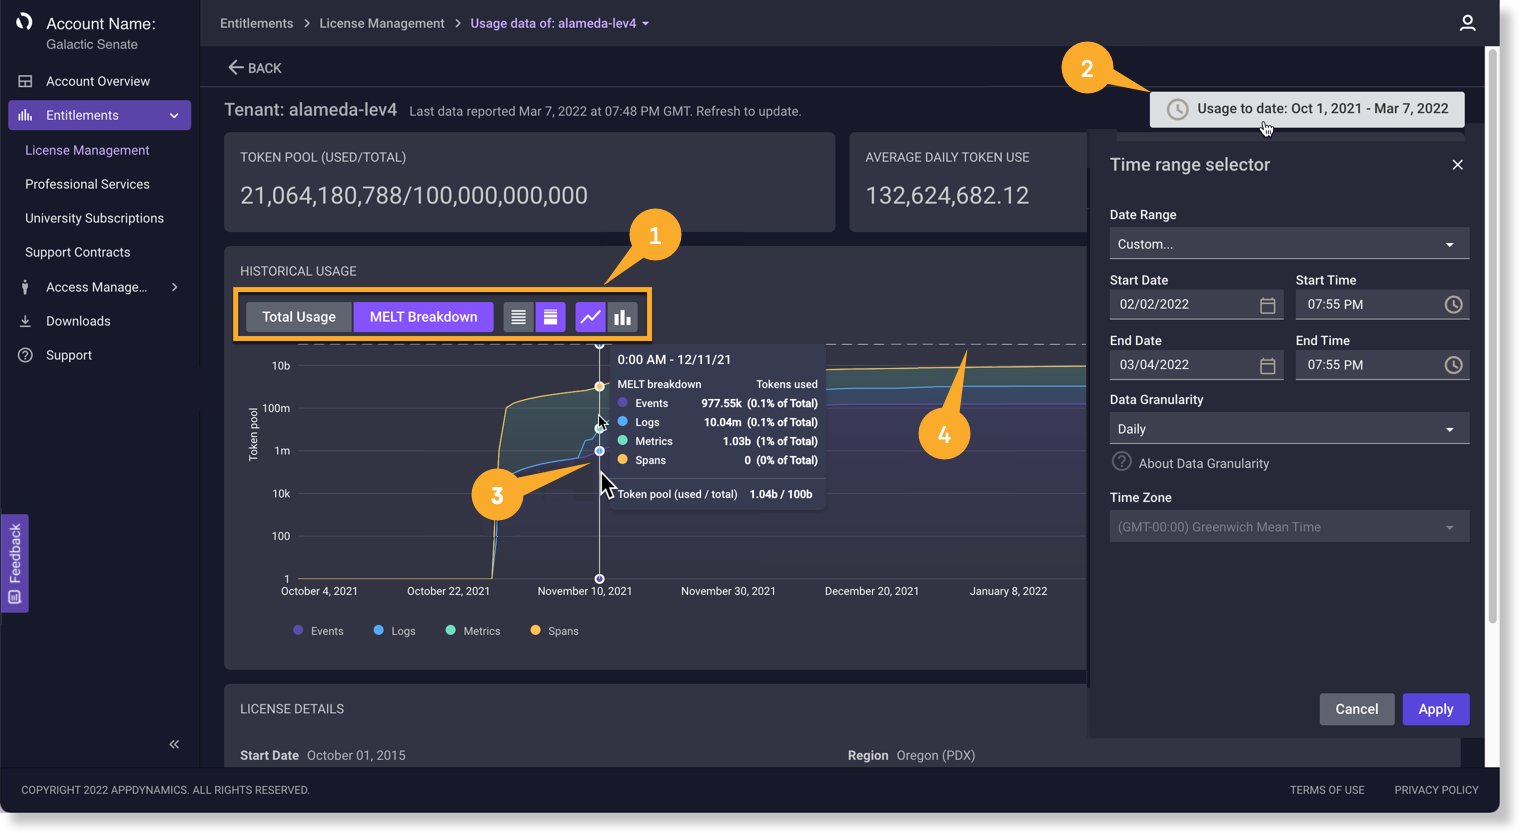
- Historical Usage—provides a customizable, graphical view of token usage for a certain time range.
- License Details—provides date, ID, retention days, and region data.
To review Historical Usage:
The Historical Usage data graph displays the total number and percentage of tokens consumed against your total allocation during either a usage cycle or a timeframe you choose.
- The y-axis represents the tokens used.
- The x-axis represents the time period.
- Select a graphical view option to customize the Historical Usage data displays.
- Total Usage—displays data in terms of number and percent of tokens used per total purchased.
- MELT Breakdown—displays data in terms of the number and percent of metrics, events, logs, and traces that consumed the tokens in your pool.
- Click
 or
or  to toggle between a linear or logarithmic scale.
 - Click or to toggle between an area or bar chart.
- Click to use the Time Range Selector to adjust the period, date, time zone, and granularity of data you want to view in the graph. There are several predefined time ranges that allow you to view past cycles quickly.
- Select Data Granularity to choose daily, hourly, weekly, or monthly detail.
- Use the calendar and time tools to set specific historical ranges.
If you select a timeframe that is too long for the aggregation, certain granularity options are not visible.
For example, if you choose a timeframe longer than one month, hourly granularity is disabled. - Select Custom to view the timeline over several usage cycles.
- Select Data Granularity
Hover over a data point on the graph to view granular metrics for that particular time
. The dashed line represents the number of provisioned tokens.
License units are always rounded up to the next highest integer because that is the minimum amount necessary for your monitoring.
To access usage statements:
You can access and download license usage statements for the current month and all the previous time periods.
- Click Usage Statements in the License Details section.
- Select an available statement type from the dropdown
- Current Month
- Last Month
- Previous Month
- Current Anniversary Cycle
- Previous Anniversary Cycle
- Click Create to display a PDF view.
- Use the PDF viewer controls to download the statement.
To view usage projection:
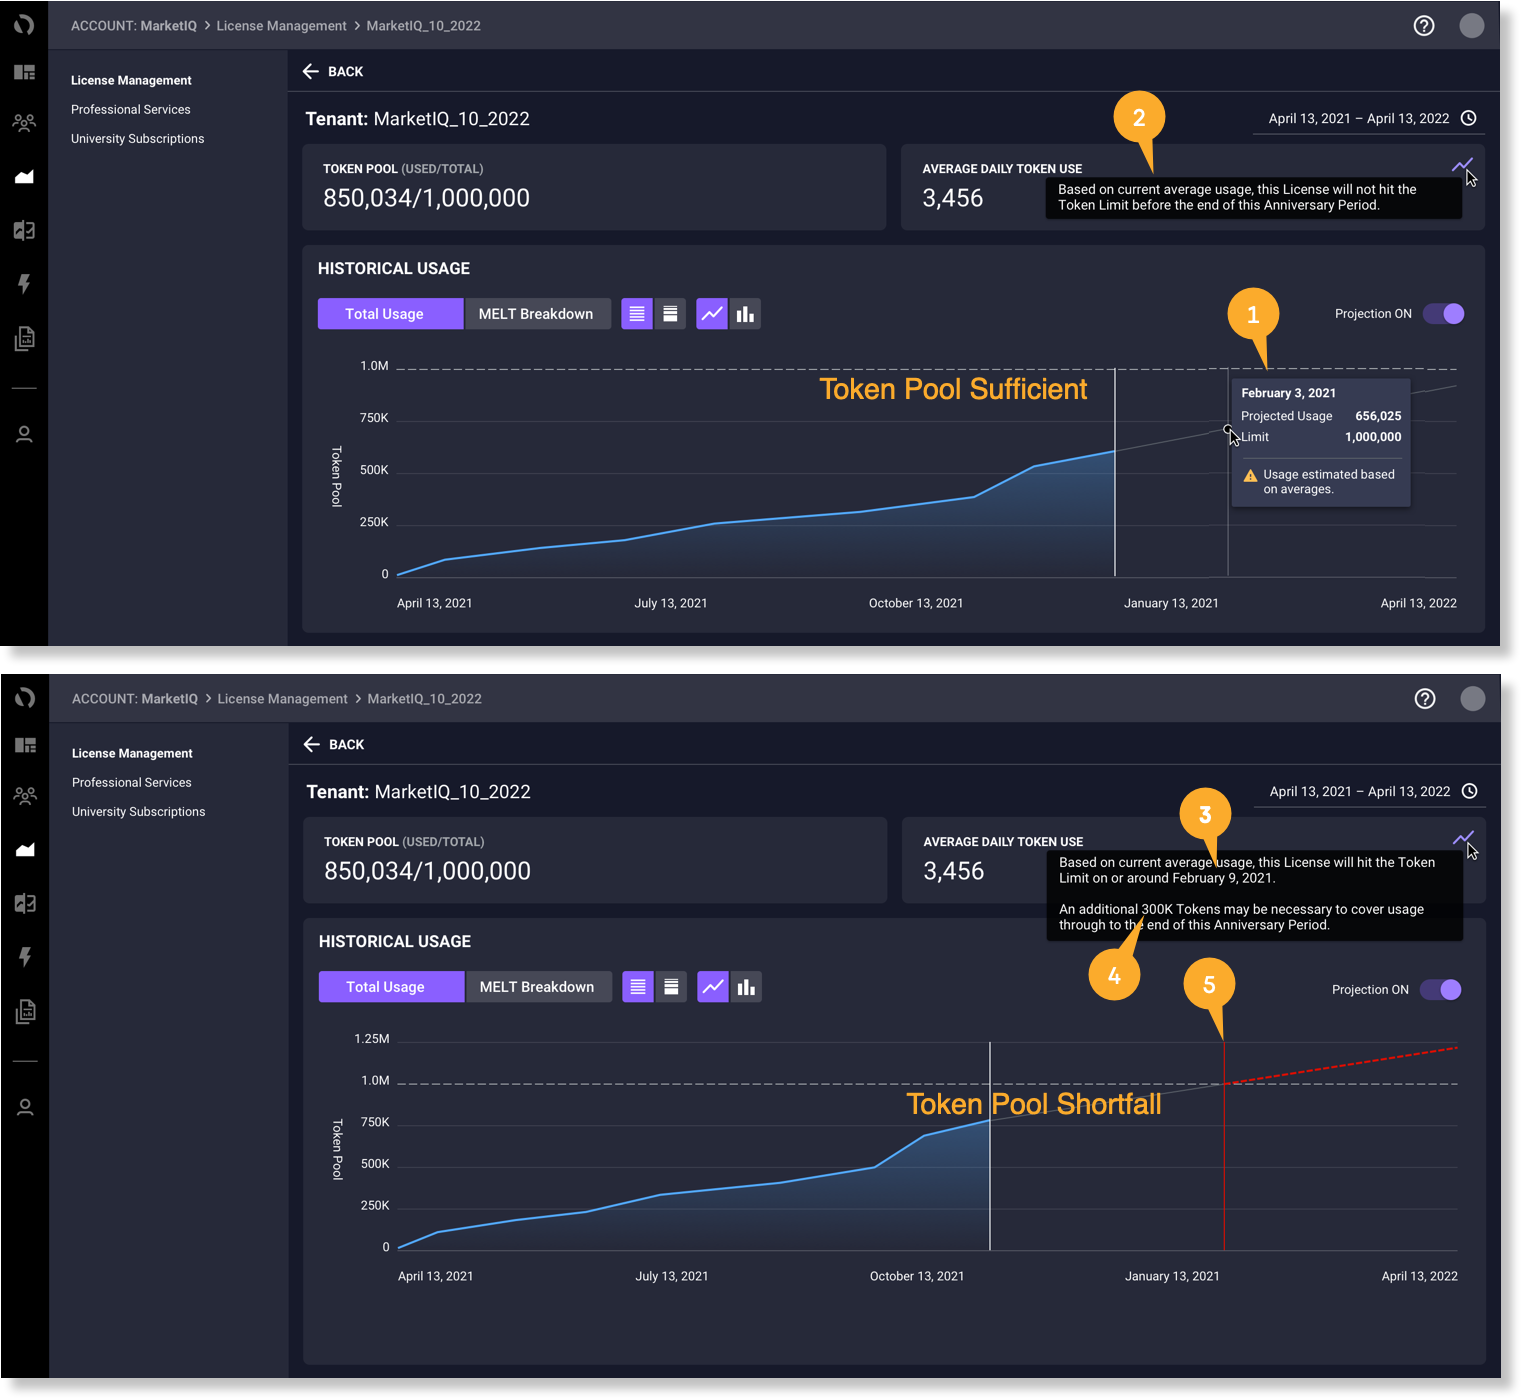
With careful planning, you can gauge annual license consumption to ensure you have enough tokens to cover your monitoring needs. However, unexpected events such as consumer market demand or application abnormalities can cause excessive token utilization. You can use the Projection feature to display current and future token consumption estimates. The estimation plotline lets you verify that you have enough tokens to cover future usage. It also provides an estimation of how many additional tokens you may need in the event of a shortfall to ensure continuous monitoring for the current license unit anniversary period.
- Click the Projection toggle to display an estimation plotline of future token usage on the graph.
- Hover over the future graph plotline to view projected usage estimates on specific dates based on your average usage.
- Hover over
 to:
to:- Know that either you have enough tokens or the date when the license may reach the token limit.
- Obtain the number of additional tokens necessary to cover usage through the anniversary period in the event of a shortfall.
- View estimation plotlines on the projected shortfall date
 .
.
- Know that either you have enough tokens
To view license overages:
You can go over your license usage limit on a per Tenant and per entitlement basis by a configurable amount determined, at the sole discretion of Cisco AppDynamics, during account setup, which is subjection to change at any time without notice.
If you begin to exceed your usage allowance, the overage utilization displays in the Overage Pool and the graph accordingly. Hover over the graph to view overage by a select date. You can also view by month, anniversary period, or a custom time period by setting a specific time range. This information can help you plan future usage requirements.