Download PDF
Download page Monitor Single-Page Applications.
Monitor Single-Page Applications
Browser RUM's single-page application (SPA) monitoring enables you to:
- Monitor the performance/throughput of user experiences of SPAs.
- Troubleshoot and resolve SPA problems within the context of the page load.
- Assist with business decisions by analyzing SPA data through analytics.
- Enable developers to quickly ship better web applications to the marketplace.
What Is SPA?
A single-page application (SPA) is a web technology and design paradigm that reduces browser-level page loads by using JavaScript to fetch resources and build pages. This creates a smoother, faster user experience more similar to a desktop or mobile application than a traditional web page. React and Angular are two popular JavaScript frameworks used to create SPAs.
Base Pages vs. Virtual Pages
When a user navigates to a SPA, the initial page download is considered the "base page." The base page includes the HTML skeleton, the core CSS, and the JavaScript framework for fetching and constructing new content. The ensuing pages are constructed from resources downloaded with the base page or fetched dynamically from the backend in response to user interaction. This new content (or views) constructed from different sources by the SPA are called "virtual pages."
For SPAs, you will have base pages, virtual pages, and Ajax requests. From Pages & AJAX Requests, you are able to view all three types and details for each as shown below.

SPA1 and SPA2 Monitoring
Until 4.4.3, Browser RUM only provided auto-instrumentation for AngularJS 1 SPA applications. For other frameworks, you had to manually report events with the JavaScript Agent API. This limited auto-instrumentation for SPA is known as SPA1 monitoring.
From JavaScript Agent >= 4.5.16, Browser RUM has been certified for Angular 1-9 (as well as Angular 12 with JavaScript Agent 21.12.0). This support for the auto-instrumentation for all SPA frameworks is known as SPA2 monitoring.
This table describes the support for SPA1 and SPA2 monitoring:
| SPA Monitoring Version | Auto-Instrumentation | Metrics | JavaScript API |
|---|---|---|---|
| SPA1 | AngularJS 1 only |
| Yes |
SPA2 | All SPA frameworks. Auto-instrumentation is certified for React and Angular 1-9 (JavaScript Agent >= 4.5.16 and Angular 12 (JavaScript Agent >= 21.12.0). |
| Yes |
Which SPA Monitoring to Use?
In general, you are highly recommended to use SPA2 monitoring. For most applications, the JavaScript Agent using SPA2 monitoring identifies the SPA transitions deterministically and captures the metrics and resources correctly without you having to write any special configuration or call methods from the JavaScript Agent API. If your SPA applications are built with AngularJS 1, you can simply add some configuration to enable auto-instrumentation.
View SPA2 Monitoring Data
Throughout the Controller, you can view SPA2 Metrics in various EUM dashboards in the Controller. You can also Configure the Primary Metric to choose a default displayed SPA2 metric for Browser RUM dashboards and widgets.
Browser Snapshots
The Browser Snapshots tab displays a list of different types of pages as shown below. You can view relevant metrics for all the pages and other metrics for base pages and Ajax requests.

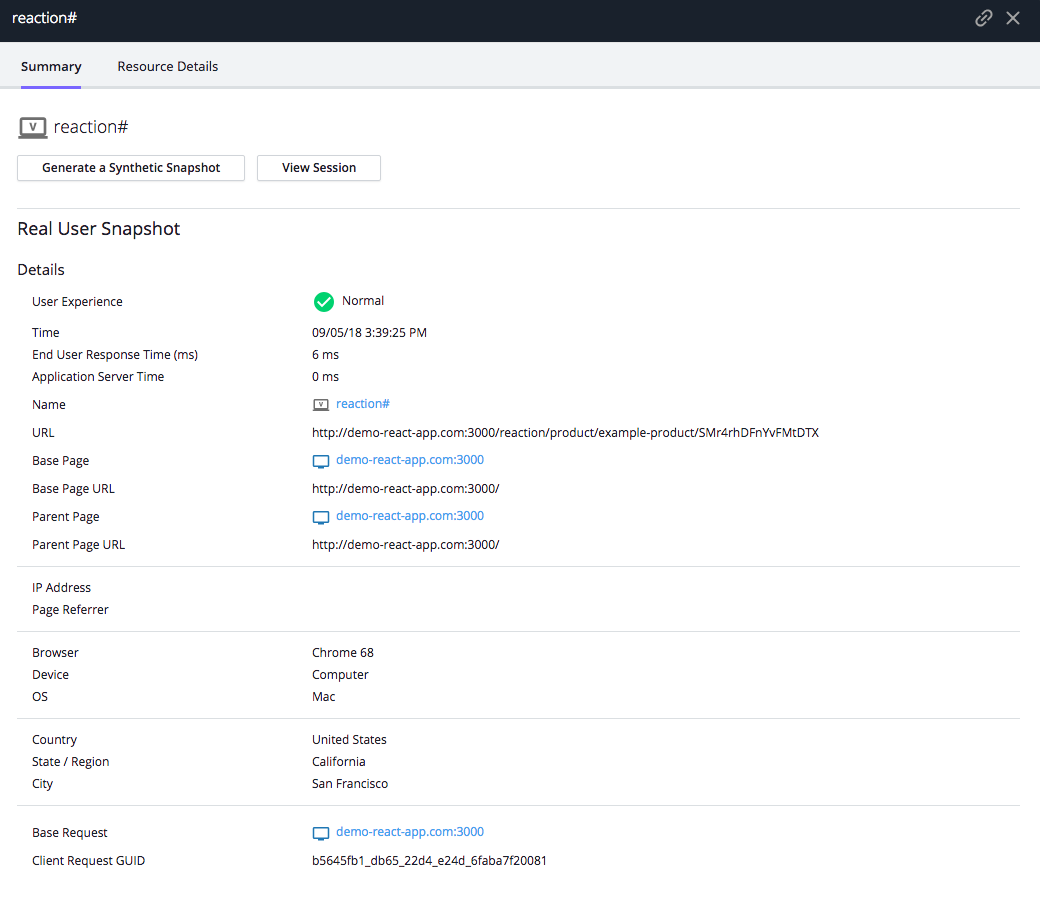
Snapshot Details: Summary
To access the Snapshot Details dialog shown below, you double-click one of the browser snapshots in the Browser Snapshots page. The Summary tab is the default tab for the dialog, and it gives some additional information such as the parent page URL.
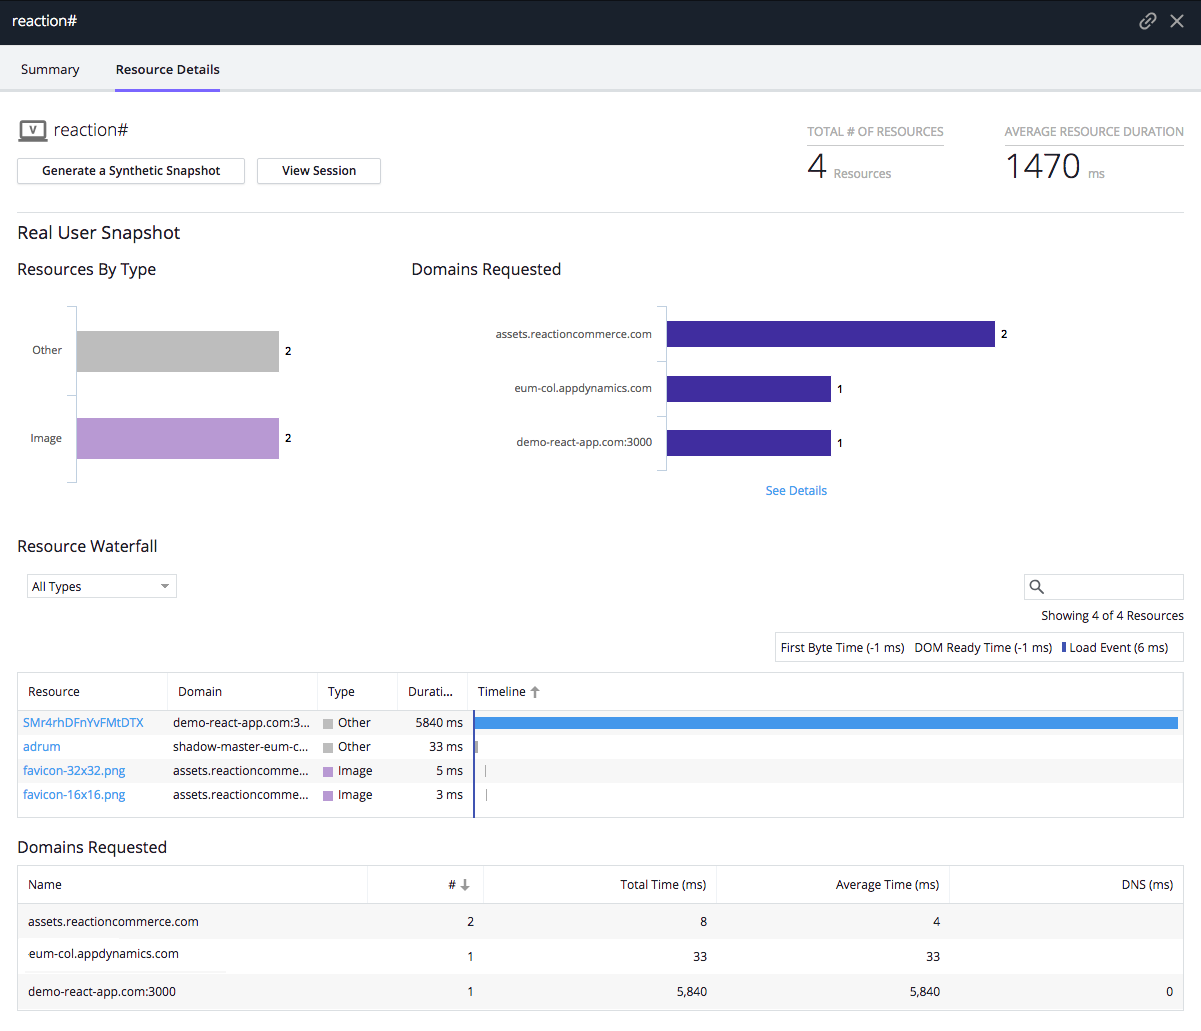
Snapshot Details: Resource Details
The Resource Details tab shown below provides details about resources such as the number and type of resources, the domains where the resources were requested, and resource load times.
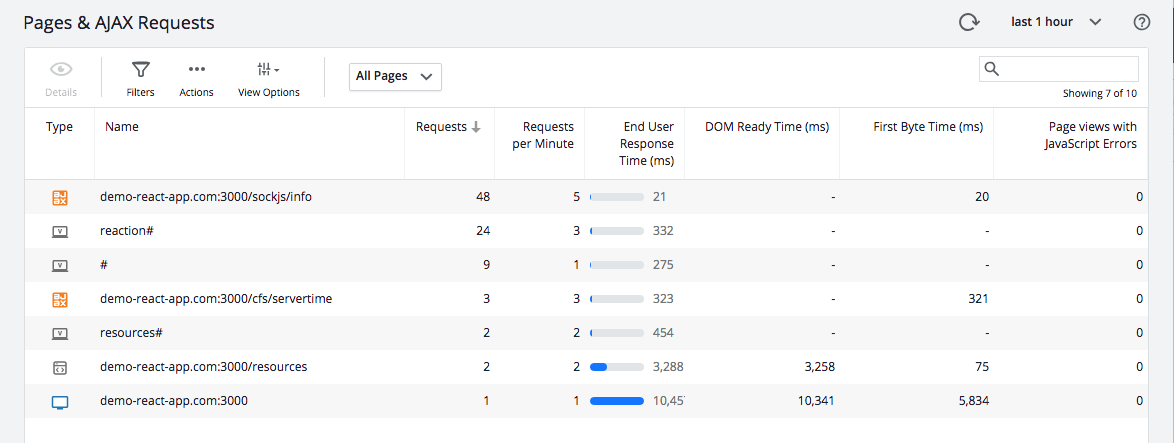
Pages & AJAX Requests
The Pages & AJAX Requests page as shown below enables you to view the number of requests for each type of page and the average metrics per page. You can also select which page types to view, such as virtual pages.
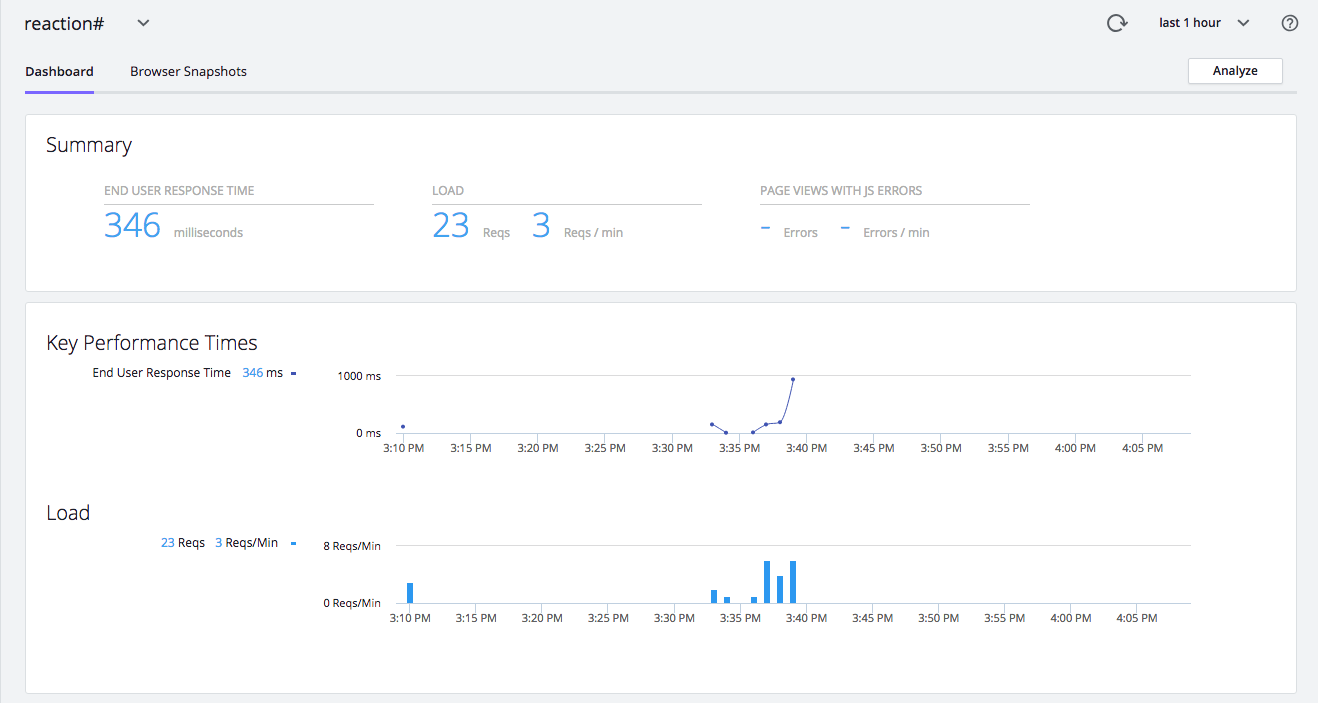
Page, Ajax, and Iframe Dashboards
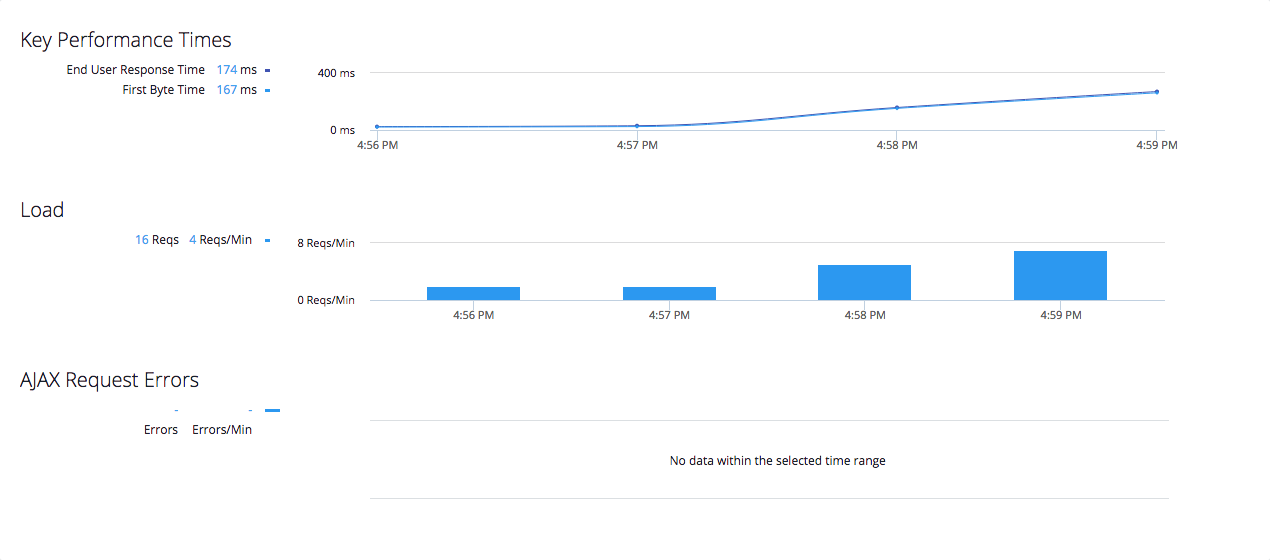
From the Pages & AJAX Requests page, you can double-click a page to view the Page and IFrame Dashboards. Dashboards for each page type will have a Summary section displaying the average metrics as well as a Key Performance Times section showing the requests and the metrics on a timeline.
The tabs below show the differences in the dashboard for each page type.
Base pages contain timing metrics such as End User Response Time, Page Complete Time, and Visually Complete time.

Virtual pages provide the resources requested.

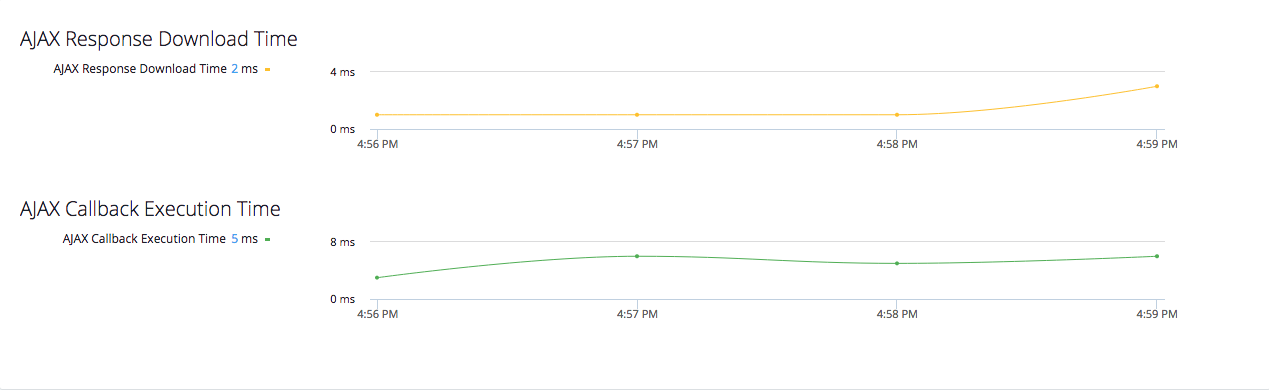
Ajax Requests include a more limited set of timing metrics as well as Ajax-specific section for the AJAX Response Download Time and the AJAX Callback Execution Time.
Browser Analyze
From Browser Analyze, you can filter by criteria, such as page types shown in the screenshot below, and configure the fields you want to view.
