AppDynamics for OpenTelemetry™ ingests and aggregates traces into Business Transaction flow metrics in the Controller UI. A trace represents an end-to-end request which can be made up of one or multiple spans. Each span represents one event within a component in the application triggered in the trace. The Business Transaction represents the entire graph of all traces sharing the same root span and visualizes how traces flow between services.
Before You Begin
To view OpenTelemetry data in the Controller UI, you need the following:
For information on data limits for AppDynamics for OpenTelemetry, see License Entitlements and Restrictions.
View OpenTelemetry Data in the Controller UI
Application Dashboard
The Application Flow Map is a dynamic visual representation of your monitored environment's components and activities. Monitored services using OpenTelemetry are represented by the OpenTelemetry telescope icon. For a list of supported language in the flow map, see Supported Languages.
To view OpenTelemetry data on your Application Dashboard:
- Go to your OpenTelemetry-enabled application.
- Click Application Dashboard > Dashboard.
After instrumentation, it may take up to five minutes for data to populate in the Controller UI.
Known Issue
For OpenTelemetry flow maps, Business Transactions (BTs) can lose the upstream context and appear as new BTs rather than continuations. This causes BTs to appear split up in the BT dashboard, resulting in BT Metrics to be split up as well.
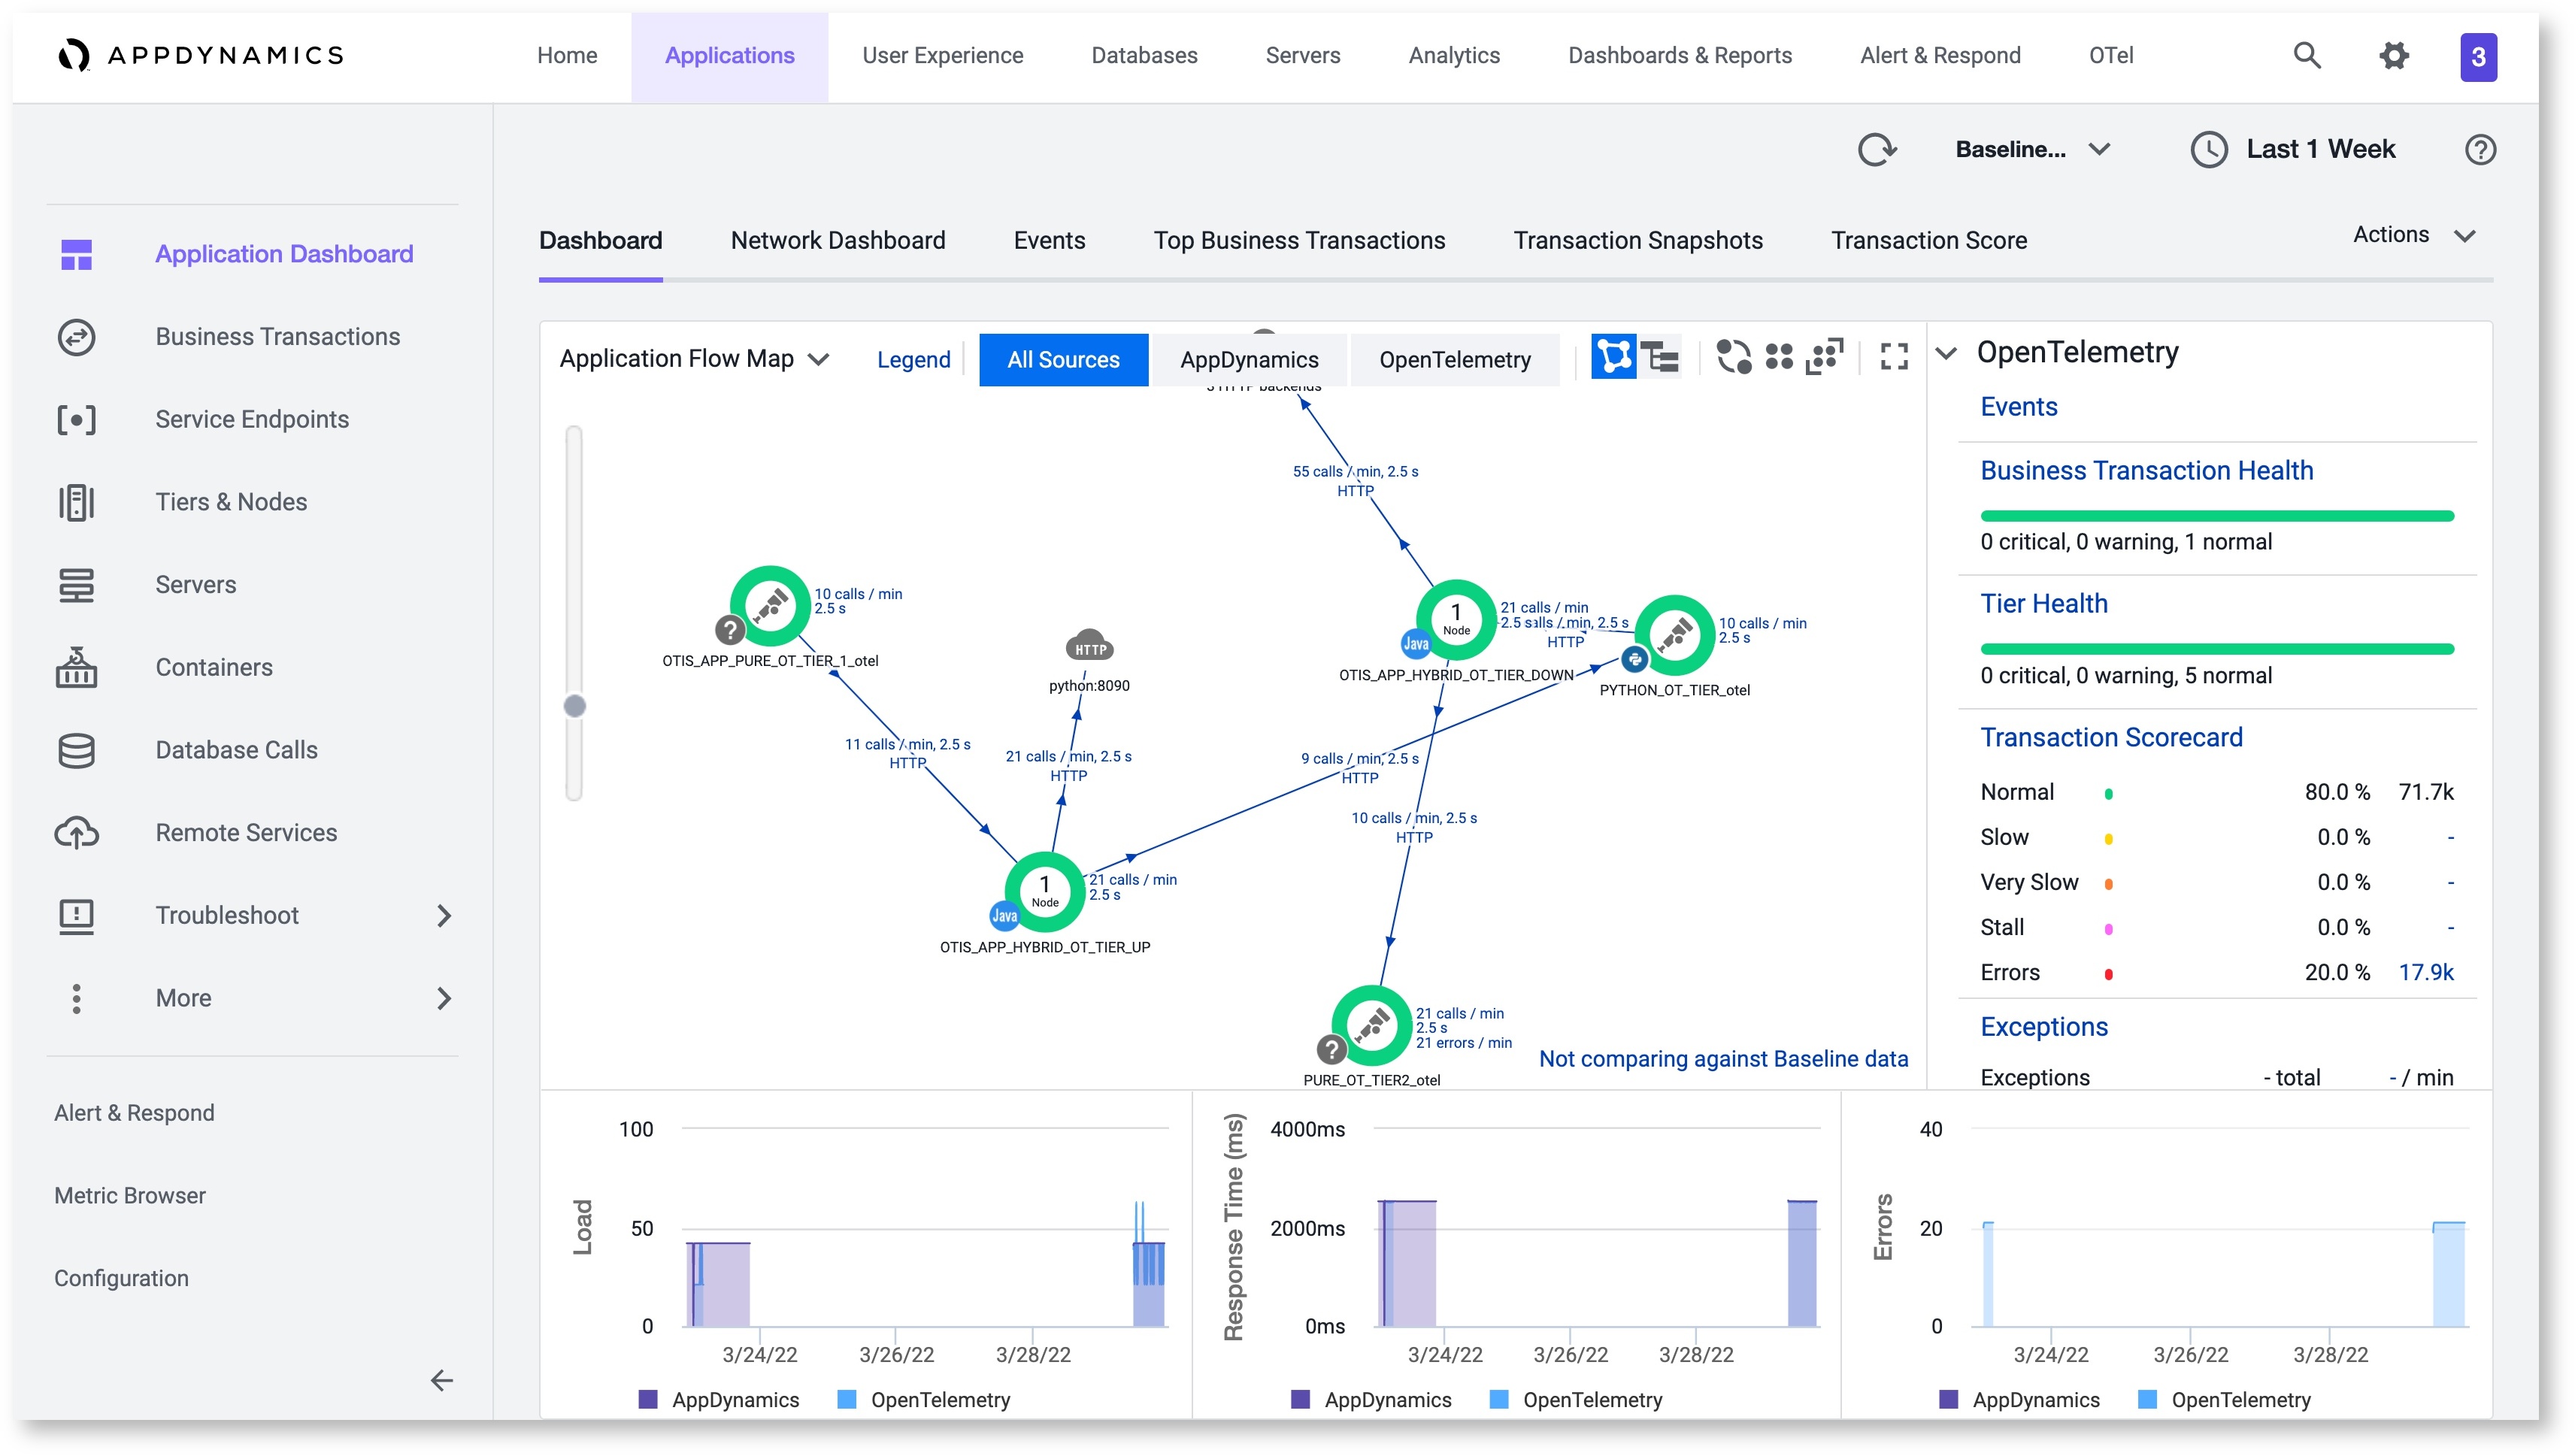
The All Sources view shows a blend OpenTelemetry and AppDynamics source data.
In the OpenTelemetry source view, the Flow Map displays data and activity between tiers. Only tiers are displayed in the OpenTelemetry source view; no node-level details are available.
If you want to look at data from just one tier, click on a tier in the Flow Map. You'll be redirected to the Tiers & Nodes Flow Map which will populate with data for that OpenTelemetry tier.
See Learn how to navigate and customize flow maps.
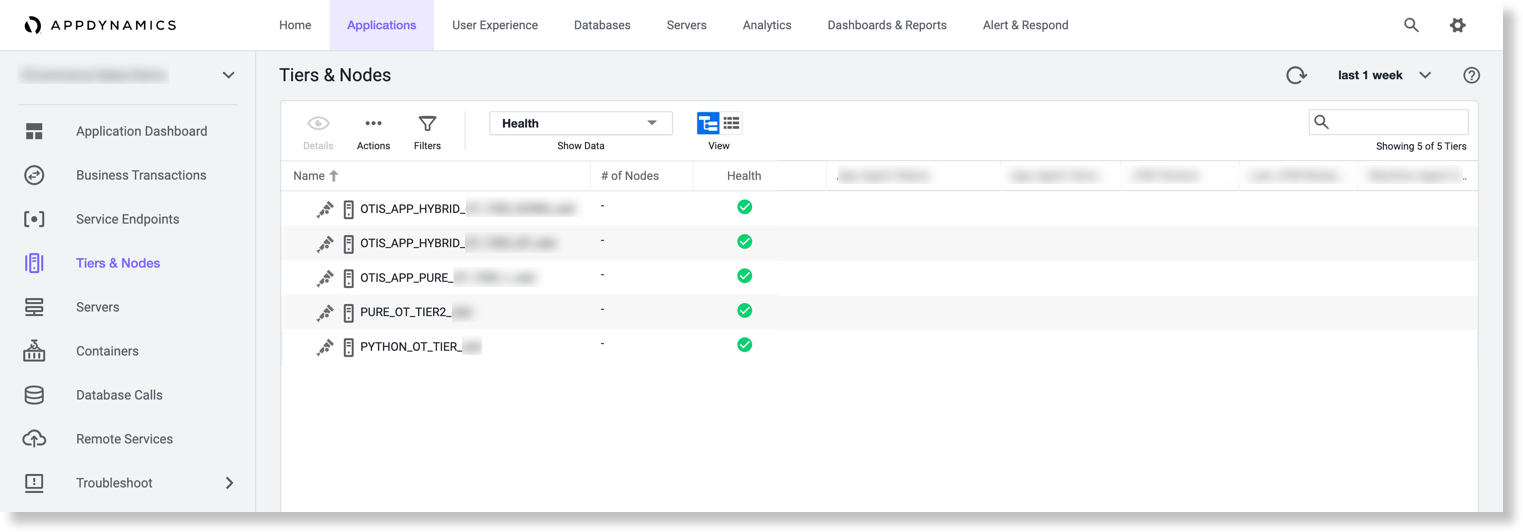
Tiers & Nodes
On Tiers & Nodes, you can view a list of all tiers in an application. The tiers represent the services (defined by service.name) that were encountered by the ingested traces. To investigate specific tiers, double-click on a tier name and see a new flow map that is updated with tier-specific data.
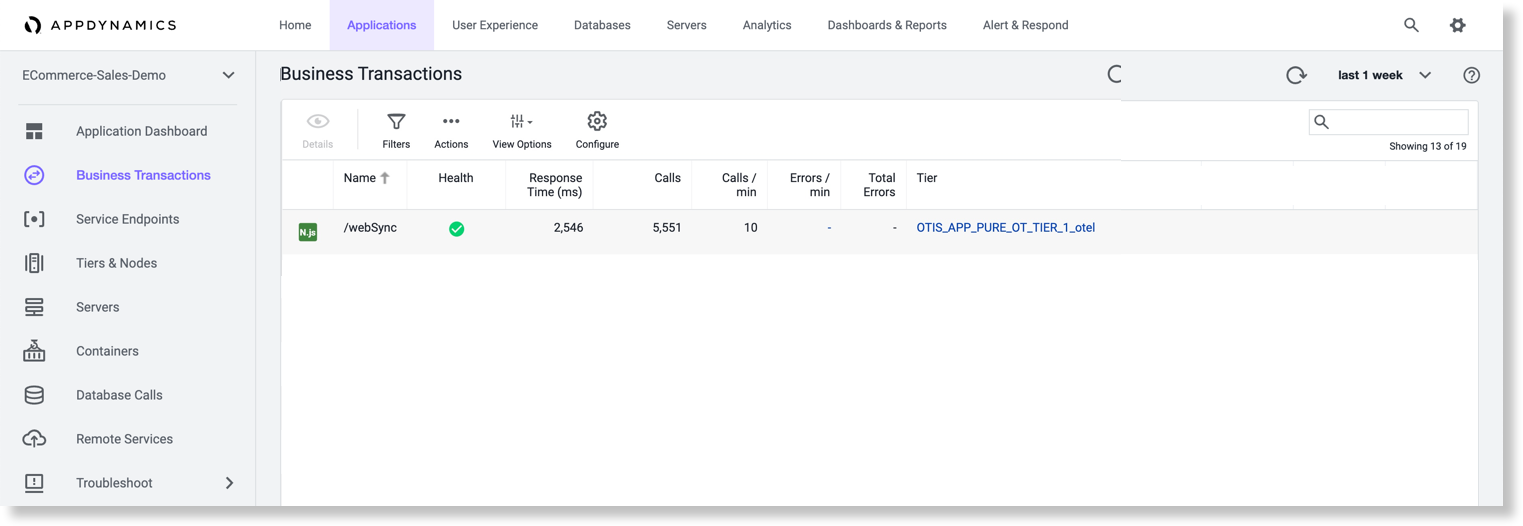
Business Transactions
On Business Transactions, the names of the Business Transactions are derived from the name of the first span of each trace (also known as the root span). The health status, response time, number of calls, and other metrics are reported for the Business Transaction.
OpenTelemetry™ is a trademark of The Linux Foundation®.