Download PDF
Download page JavaScript Errors Dashboard.
JavaScript Errors Dashboard
The JavaScript Errors dashboard captures detailed information about JavaScript errors in your browser application. With the JavaScript Errors dashboard, you can:
- View all JavaScript errors in your browser app within a selected time frame.
- Drill down into a single error instance and its impact.
- View error instances and details listed by time stamp and page name.
- Upload maps and files to troubleshoot the error in the source code.
Requirements
To access the JavaScript Errors dashboard, you need the following:
- SaaS Controller >= 22.2.0
- JavaScript Agent >= 22.2.0.
Region Support
The JavaScript Errors dashboard is available in the following SaaS regions and cities:
Region | City |
|---|---|
Americas | Oregon |
EMEA | Frankfurt |
APAC | Sydney |
JavaScript Errors Dashboard
To access the JavaScript Errors dashboard in the Controller UI:
- Go to User Experience and select a browser app.
- In the left-hand panel, click on JavaScript Errors.
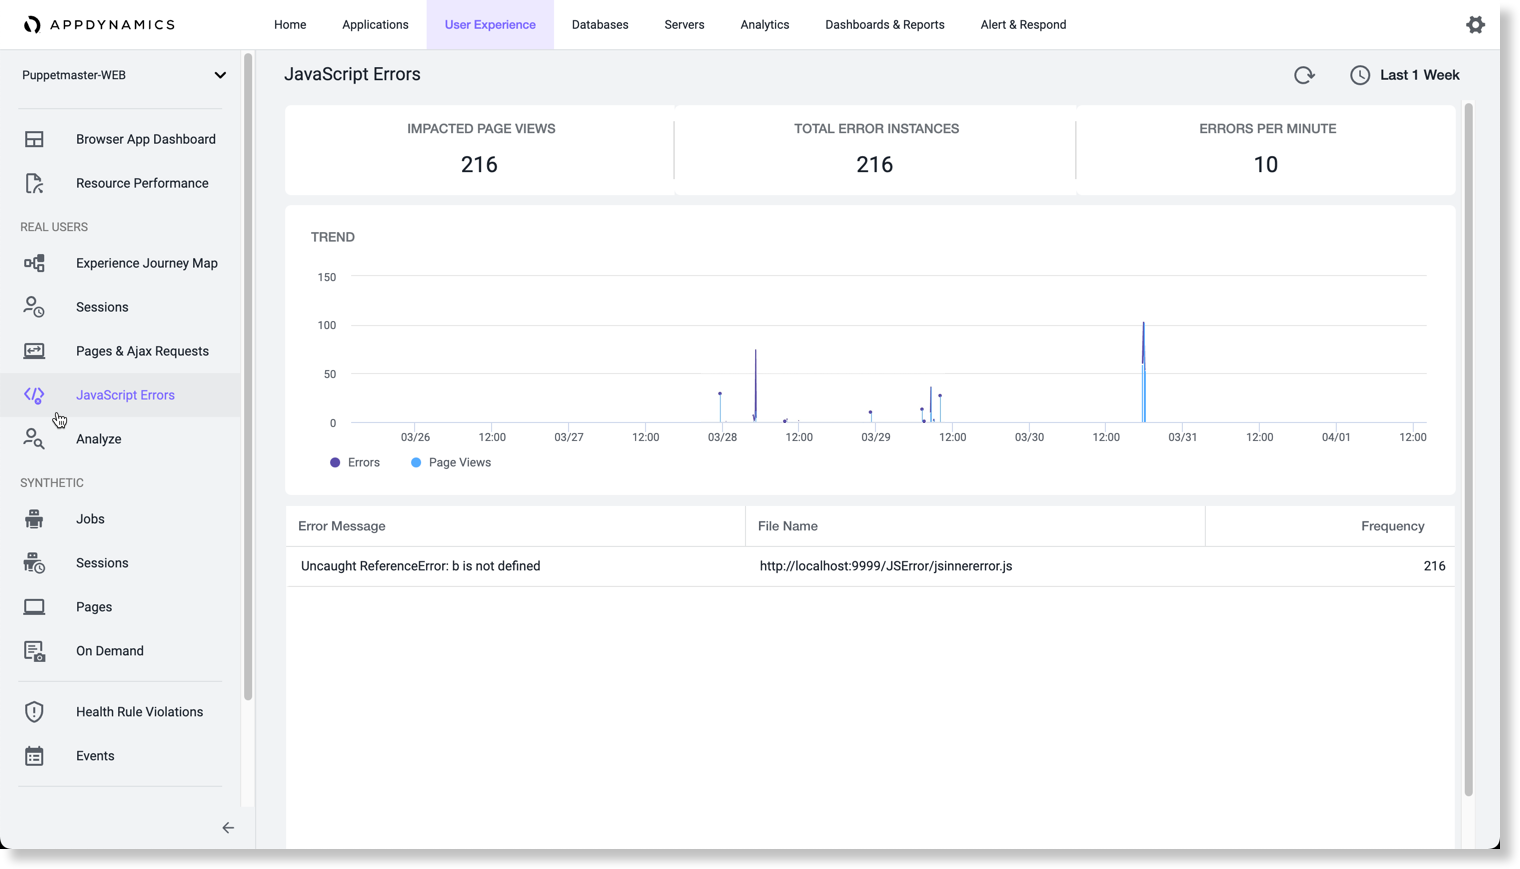
The JavaScript Errors dashboard displays all JavaScript errors in a browser app within a time range. The Trend widget displays the error count and timestamp within a time frame.
In the table listing individual error messages, you can drill down into a single error instance by double-clicking on the error message, which takes you to the JavaScript Error Summary view.
Error Summary
When you click on an error message from the JavaScript Error Dashboard, you are directed to the Summary tab which displays the following metrics:
- Impacted Pageviews: Number of Pageviews (instances of browser app web pages) impacted by the error
- Error instances: Number of error instances across all web pages
- % of total error instances: One specific error divided by the total number of errors (across all web pages)
- Errors per minute: How many times this specific error occurred per minute
- First occurrence: Timestamp of the first error occurrence
Error Instances
When looking at an individual error, the Instances tab lists details of every error.
On an error instance you can:
- Expand the error message to show the stack frames
- Click the stack frame to show the error properties, such as end-user device details and script origins.
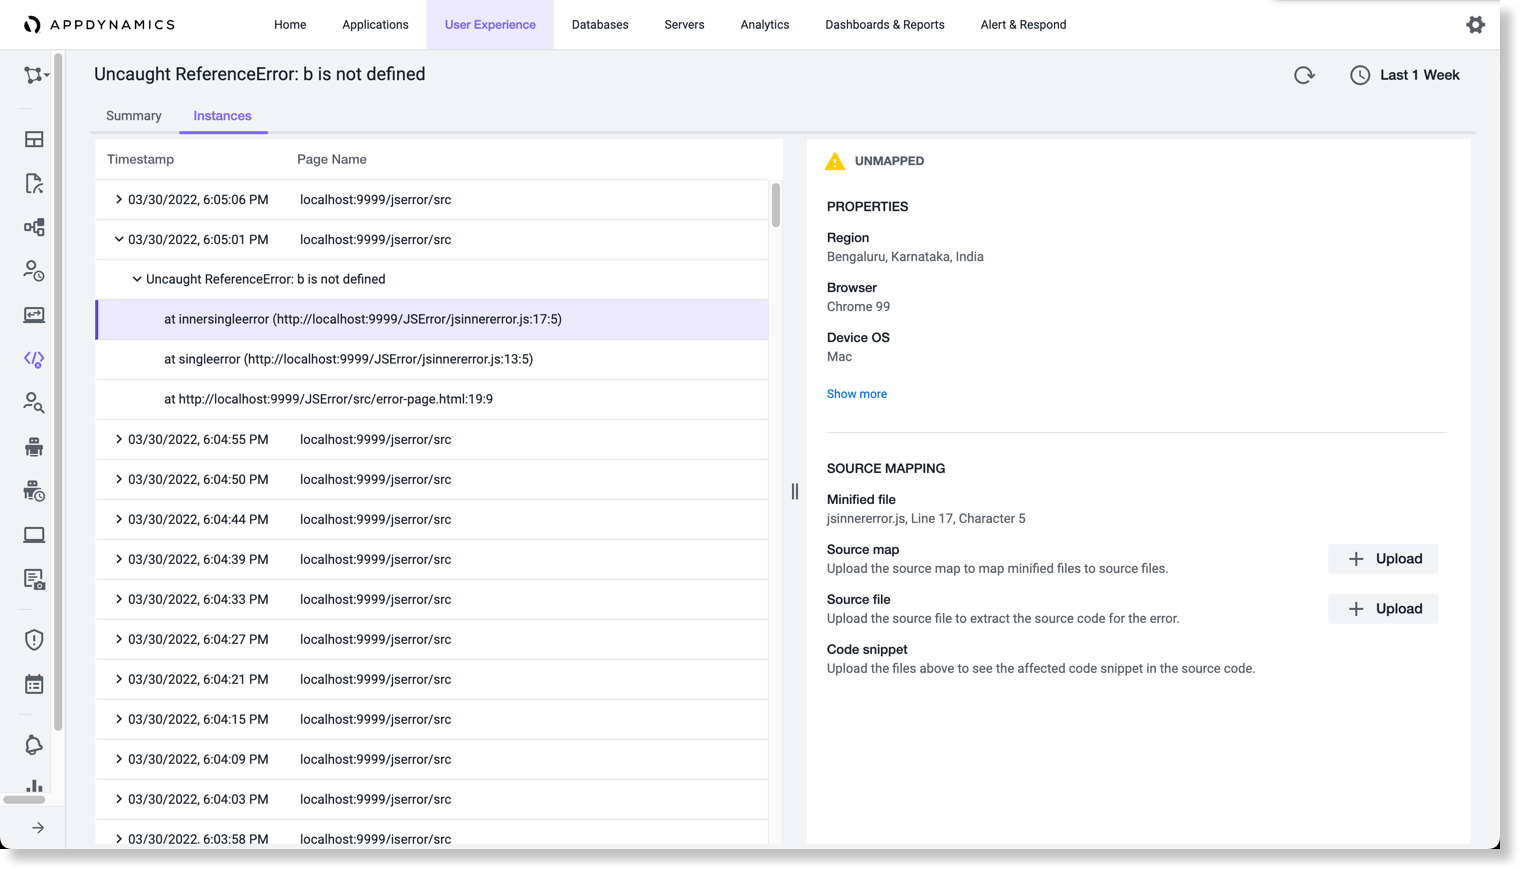
In the Properties section, scroll down to Source Mapping where you can upload source map and source files to locate where the error occurred in source code.
Source Mapping
When troubleshooting errors, it's helpful to know exactly where the error occurred in the JavaScript code. You can upload your application's source map and source file to find the exact location of the error.
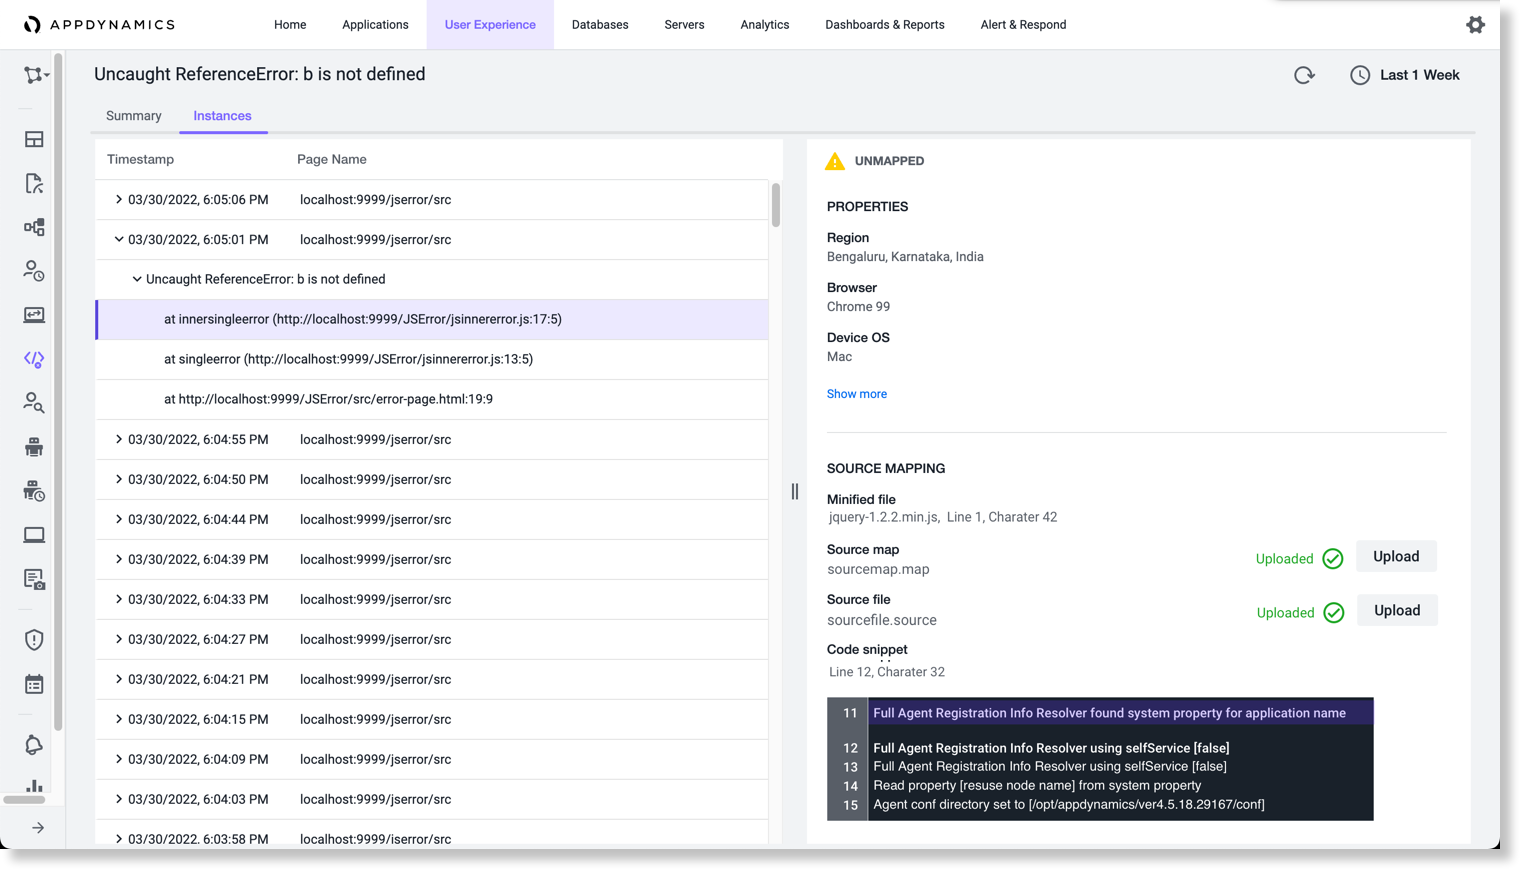
On the Instances tab, when you expand on the script origin of the error, the Source Mapping section allows you to upload a source map and source file to further troubleshoot the error. When you upload the map and files, the HTML snippet will populate with the file source code and highlight exactly where in the source code the error occurred.
To upload a source map and source file:
- Expand on an error message.
- Click on a stack frame.
- In the Properties section, scroll down to Source Mapping.
Click Upload to upload the JSON source map and source files (The max size allowed for source map and source files is 10 MB).
Once the source map and source file are uploaded, the HTML snippet will populate with highlighted JavaScript where the error occurred. You can use these details to fix the errors.
Source Mapping Tips and Recommendations
You have a few options for which source map and source files to upload. You can:
- Only upload the source map file (if the source map file also contains the source file).
- Upload the source map file first and then upload the source file.
Only upload the source file (without the source map file).
If you upload the source map file after uploading source file, the source file uploaded will be removed automatically.
You can upload one or more source files. Once the source map files is uploaded, the UI shows a list of source files associated with that source map file.
We recommend that you use different names for source files that share the same source map. Even if the source files are located in different paths, if the first source file is named /path/to/myBrowserApp.js and the second source file is named /different/path/to/myBrowserApp.js, if you upload the first source file /path/to/myBrowserApp.js, and later upload the second source file /different/path/to/myBrowserApp.js, if you were to go back to the stack associated with the first source file, you would need to re-upload the first source file again. This is because the source files are persisted using their file name as an identifier.
(Optional) Add Application Release Information in the JavaScript Agent
Before using the Source Mapping functionality, you can add your application's release information, such as release name, version, or key, in your application. When errors occur, the JavaScript Agent sends beacons containing error information and the release ID. When you upload the source map and source file to troubleshoot errors, the release IDs will match and highlight the exact line of code that caused the error. See Add Application Release Details to configure the release ID.