Database Visibility provides overall views of your databases that show key performance indicators.
Access the Databases Window
From AppDynamics Home, click Databases.
Features of the Databases Window
On the views of the Databases window you can:
Show only databases meeting certain criteria by entering search criteria in the search box on the top right of the page.
Click Filters to show only databases meeting certain search criteria, such as criteria that describes Health, Load, Time in database or Type.
Click + to add a new database Collector.
Click Actions to export the data on this window in a .csv formatted file that is automatically downloaded to your specified downloads directory.
Click View to switch between card and list view.
See the overall performance of your databases and if there are any critical issues with them. The server health or status indicates whether criteria has been met for normal, warning or critical health rules. The green checkmark indicates that the database is operating within normal conditions, the red exclamation mark indicates that at least one critical health rule has been violated.
Click the name of the database to switch to the Database Dashboard for that specific database.
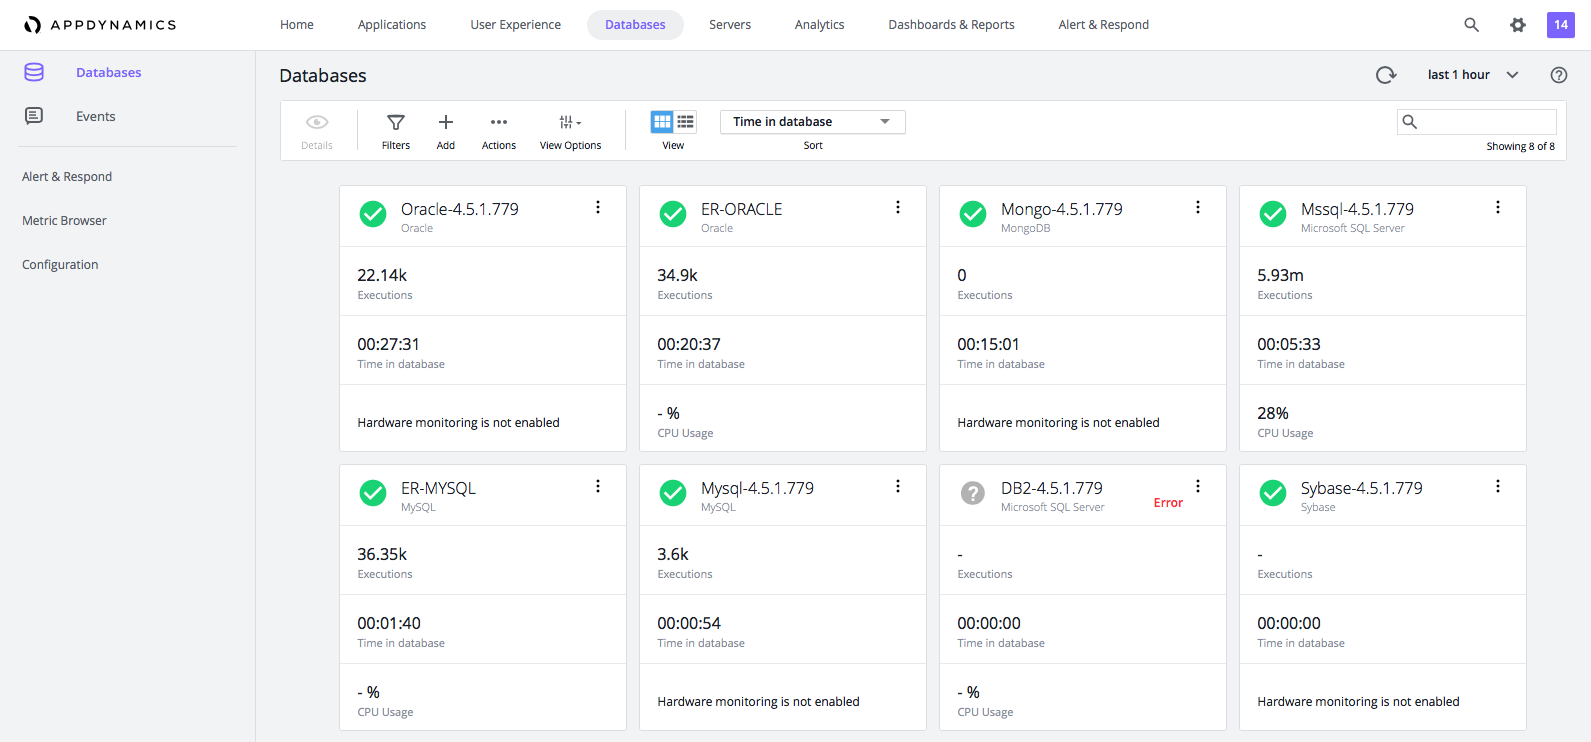
Databases Card View
From the Databases card view, you can view:
The configured collectors along with the database type and the number of nodes used in the database cluster.
The Total Executions graph that provides insight into the total number of calls (transactions for PostgreSQL databases) monitored for the database over the selected time period.
The Time in Database graph that indicates the total time spent executing those calls during the selected time period. This metric is expressed in hours, minutes, and seconds.
CPU Usage metrics that when enabled shows the percentage of CPU capacity consumed by the database.
Databases List View
From the Databases list view, you can:
View the number of database nodes under the Nodes column.
Click View Options to turn the spark charts on and off.
Get to the databases you want to see quickly if you are monitoring many databases.
Click on any point in the spark charts to see a metric for that point in time. For example, clicking on a point in the calls Trend shows how many calls were monitored at that time.
Click on a column name to sort the list on that key.