Download PDF
Download page Database Dashboard.
Database Dashboard
The dashboard for each individual database provides detailed information about your database.
Permissions
To view database collectors, users need a role with the Can View All Collectors permission.
Access the Database Dashboard
You can access the Database Dashboard in one of these ways:
- In AppDynamics Home, on the Databases card, click the name of the database for which you want to see the Database Dashboard.
- In the Databases overview panel, click the name of the database for which you want to see the Database Dashboard.
Features of the Database Dashboard
On the Database Dashboard you can:
Click the dropdown arrow next to the database Collector name at the top of the page to choose a database that you want to see the dashboard for.
(From 21.5 onwards) For a clustered database, click the down-arrow below the collector name to navigate between different nodes of the cluster. By default, All Nodes is selected.
Click the down-arrow next to the clustered database Collector name to navigate between different nodes of the cluster.
Click the status icon below SERVERS in the top section of the dashboard to go directly to Events where you can see any recent events.
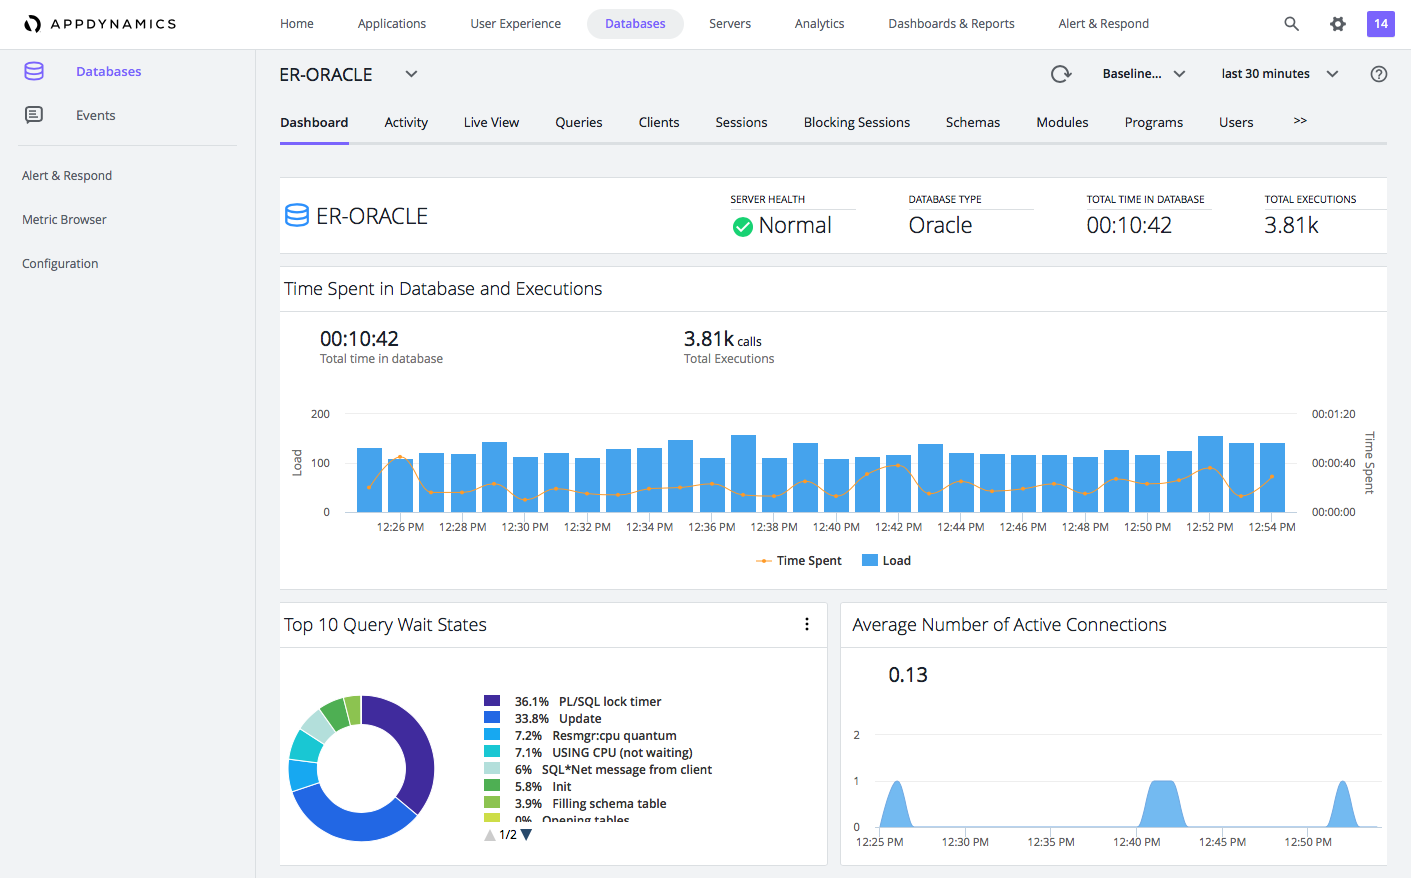
On the Database Dashboard, you can view:
- Server Health: Server Health at the top of this panel indicates the extent to which health rules are being violated:
- Green - Healthy server
- Yellow/orange - server with warning-level violations
- Red - server with critical-level violations
- Type: The database type.
- Time Spent in Database and Executions:
- Load - At a glance, you can see the total number of calls (transactions for PostgreSQL databases) during the specified time period and the number of calls for any point in time.
- Time spent in Database - The total time spent executing SQL statements during the specified time period.
- Changes - Changes made to the database configuration parameters.
- Max CPU - It displays the CPU cores present in the database server and is disabled by default. The CPU core count is collected using SQL (for Oracle, DB2, and MSSQL) and Hardware monitoring (if enabled for MySQL, PostgreSQL and Sybase).
- Top 10 SQL Wait States (not available for Couchbase): Activities that contribute to the time it takes the database to service the request. The wait states consuming the most time may point to performance bottlenecks. For example, a db file sequential read wait state may be caused by segment header contention on indexes or by disk contention. See your database platform documentation for descriptions of the SQL wait states. For example:
- Wait State - CHECKPOINT_QUEUE
- Description - Used by background worker that waits on events on queue to process checkpoint requests.
- Recommended Action - You should be able to safely ignore this action because it indicates that the checkpoint background worker is waiting for work to do. If you thought you had issues with checkpoints not working or log truncation, you might see if this worker ever "wakes up". Expect higher wait times as this will only wake up when there is work to do.
- Top 10 Phases (Couchbase only): The phases that have processed the most documents.
- Average number of active connections: This is a derived metric. This calculates the average number of queries that execute every second in the period of one minute.
The metric displays Number of connections, which represents the average number of active query execution.
For example: If there are 3 queries running every second for a one-minute duration, then the number of connections is 3.
Accessing the Comparison Report
Click on any data point to view the time comparison report, which shows query run times and wait states 15 minutes before, and 15 minutes after the selected time.
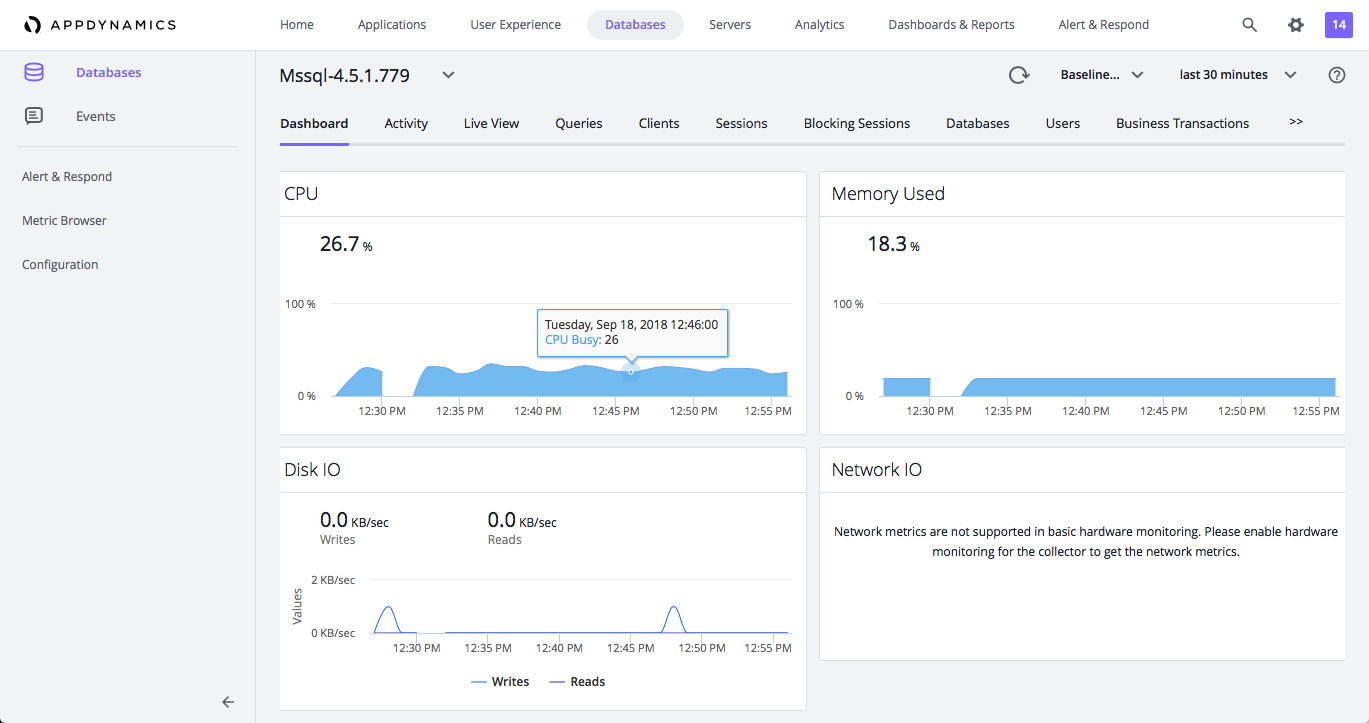
The CPU, Memory, Disk I/O, and Network I/O graphs display when the Database Agent has been configured to also monitor the database host hardware. See, "Configure the Database Agent to Monitor Server Hardware" on Add Database Collectors.
- CPU: The CPU graph shows the relative percentages of CPU processing time used for handling system and users processes.
- Memory: The Memory graph shows the percentage of total memory in use at any point in time.
- Disk I/O: The Disk I/O graph shows disk usage, the volume of data read and written.
- Network I/O: The Network I/O graph shows network activity, the volume of data sent and received.
Accessing the Metric Browser
To see more information about a specific metric, double click any point on the graph and the Metric Browser opens displaying that metric. You can then hover over a point on the graph in the Metric Browser for more information about the metric. This feature is available for all the graphs except the SQL wait states graph.
Hardware Metrics
| Metrics | Description |
|---|---|
| CPU | |
| ActiveCPU | The percentage of CPU used in the server. |
| Memory | |
| UsedMemory | The amount of memory used in the server. |
| PercMemoryUsed | The amount of memory used (in percentage) in the server. |
| FreeMemory | The amount of memory available in the server. |
| TotalMemory | The total amount of memory in the server. |
| Disk I/O | |
| ReadOPS RATES | The number of disc reads per second. |
| ReadKBS RATES | The number of bytes read from the disc in kilobytes per second. |
| WriteOPS RATES | The number of disc writes per second. |
| WriteKBS RATES | The number of bytes written to the disc in kilobytes per second. |