Download PDF
Download page Diagnostic Actions.
Diagnostic Actions
This page provides an overview of diagnostic actions in AppDynamics.
A diagnostic action can:
- Start a diagnostic session to collect snapshots
- Take a thread dump for Java only
When performance is slow or your application is experiencing a lot of errors, you can start a diagnostic action to find the root cause.
You can start a diagnostic session only for a health rule that monitors business transactions.
A diagnostic session provides a view into captured transaction snapshots with full call graphs. These snapshots help you diagnose violations of business transaction performance health rules or slow or stalled transaction events. The affected entity of the event triggering a diagnostic session must be a business transaction.
A thread dump is a general-purpose snapshot of the state of all threads that are part of a JVM process. The state of each thread is presented with a stack trace that shows the contents of each thread’s stack. Thread dumps are used for diagnosing JVM performance problems, such as code deadlocks.
Diagnostic Session Actions
A diagnostic session is always associated with a business transaction. It shows transaction snapshots with full call graphs to help you drill down to the root cause of a problem.
To create a diagnostic session action:
- Access the Actions Configuration pane. See Create and Modify Actions in Actions.
- Under Diagnostics, select Start a Diagnostic Session on the selected Business Transactions in the Create Action pane and click OK.
- After entering a name for the action, the duration of the diagnostic session in minutes and the number of snapshots to take per minute, select whether a diagnostic session will be started for any business transaction affected by the event or for specific business transactions.
If you choose specific business transactions, specify the business transactions that will trigger the diagnostic session by moving them from the available list to the selected list. The business transactions that you can specify are not limited to those that triggered the action. - Click OK.
Diagnostic Action Results
The results of a diagnostic action that has executed are available in the events list for the event that triggered the action. To get the details of a diagnostic session or a thread dump that has been initiated by an action:
- In the Events list, locate the row for the event that triggered the action for which you want to see the results.
- In the Actions column:
- Click
 to see the details of a thread dump action.
 - Click
 to see the details of a diagnostic session action.
- Click
On disk, the thread dumps are stored in the app_agent_operation_logs directory in the Controller Home. The files are named based on the ID in the app_agent_operation table.
Threads identified by AD Thread are threads initiated by the AppDynamics app agent code.
Thread Dump Actions 
You can direct the Java Agent to take a thread dump for a specified number of samples (maximum of 50) with each sample lasting for a specified number of milliseconds—a maximum of 500 ms. The thread dump is executed on the node monitored by the agent.

Agent Limit on Thread Dumps
One thread dump operation is executed at a time. They are not executed in parallel. If additional thread dump requests are received while one is being executed, they are queued with a limit of five per agent.
If the five thread dumps per agent limit is exceeded, the console shows an event with a thread dump operation that was skipped because of the limit and the associated action dialog for the executed policy links to this event.
To create a thread dump action:
- Access the Create Action pane.
- Under Diagnostics, select Take a thread dump in the Create Action pane and click OK.
- Enter a name for the action, the number of samples to take and the interval between the thread dumps in milliseconds. If you want to mandate an approval before the thread dump action can be started, check the Require approval before executing this Action checkbox and enter the email address of the individual or group that is authorized to approve the action. See Actions Requiring Approval.
- Click OK.
When a thread dump action is triggered by a backend discovery event, if the backend is not resolved quickly the policy will not start the thread dump.
Action Execution for Nodes
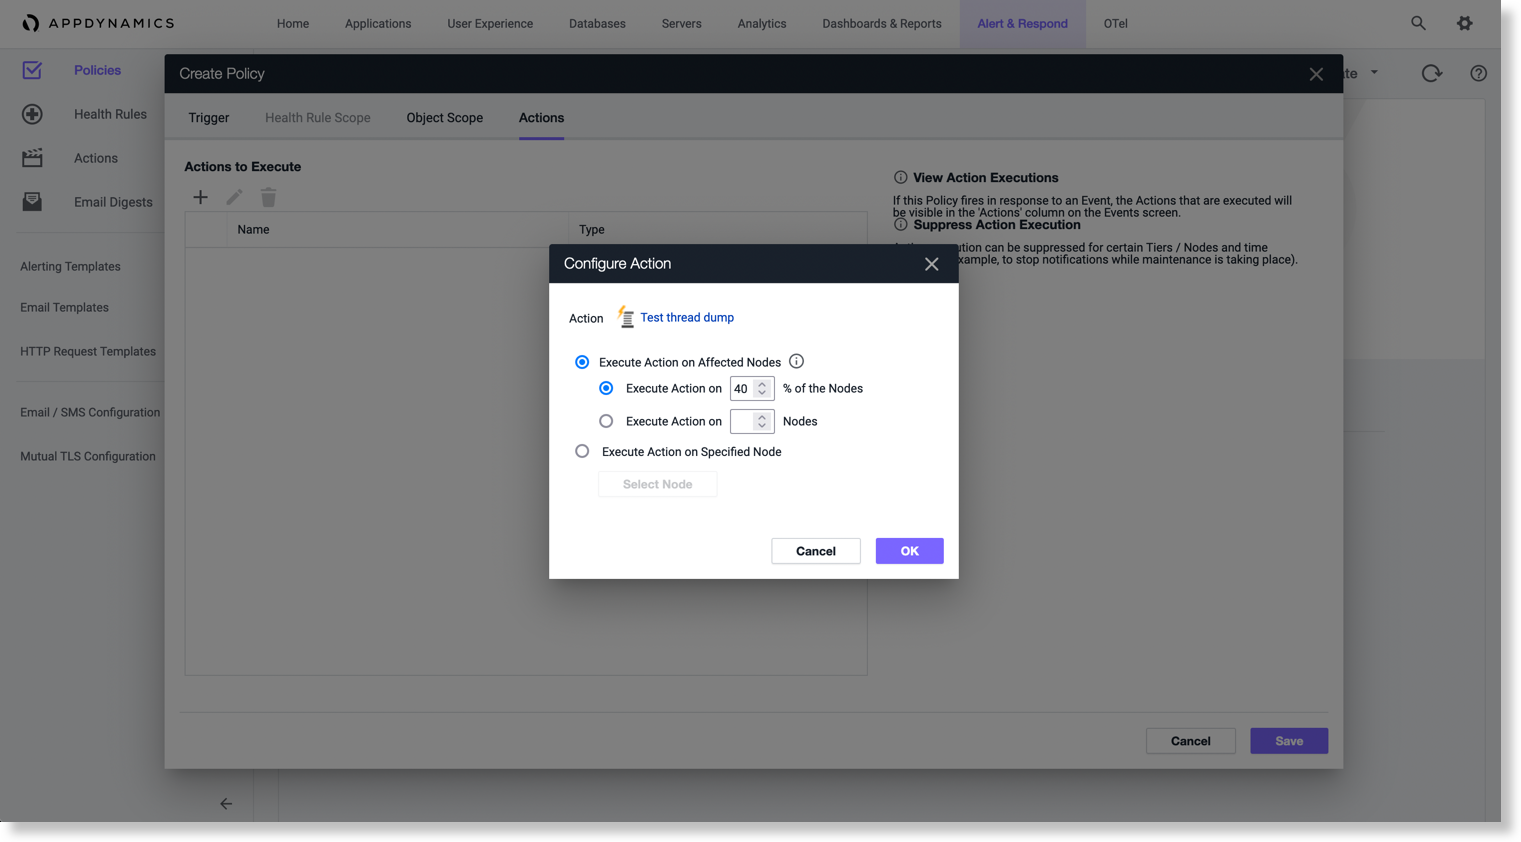
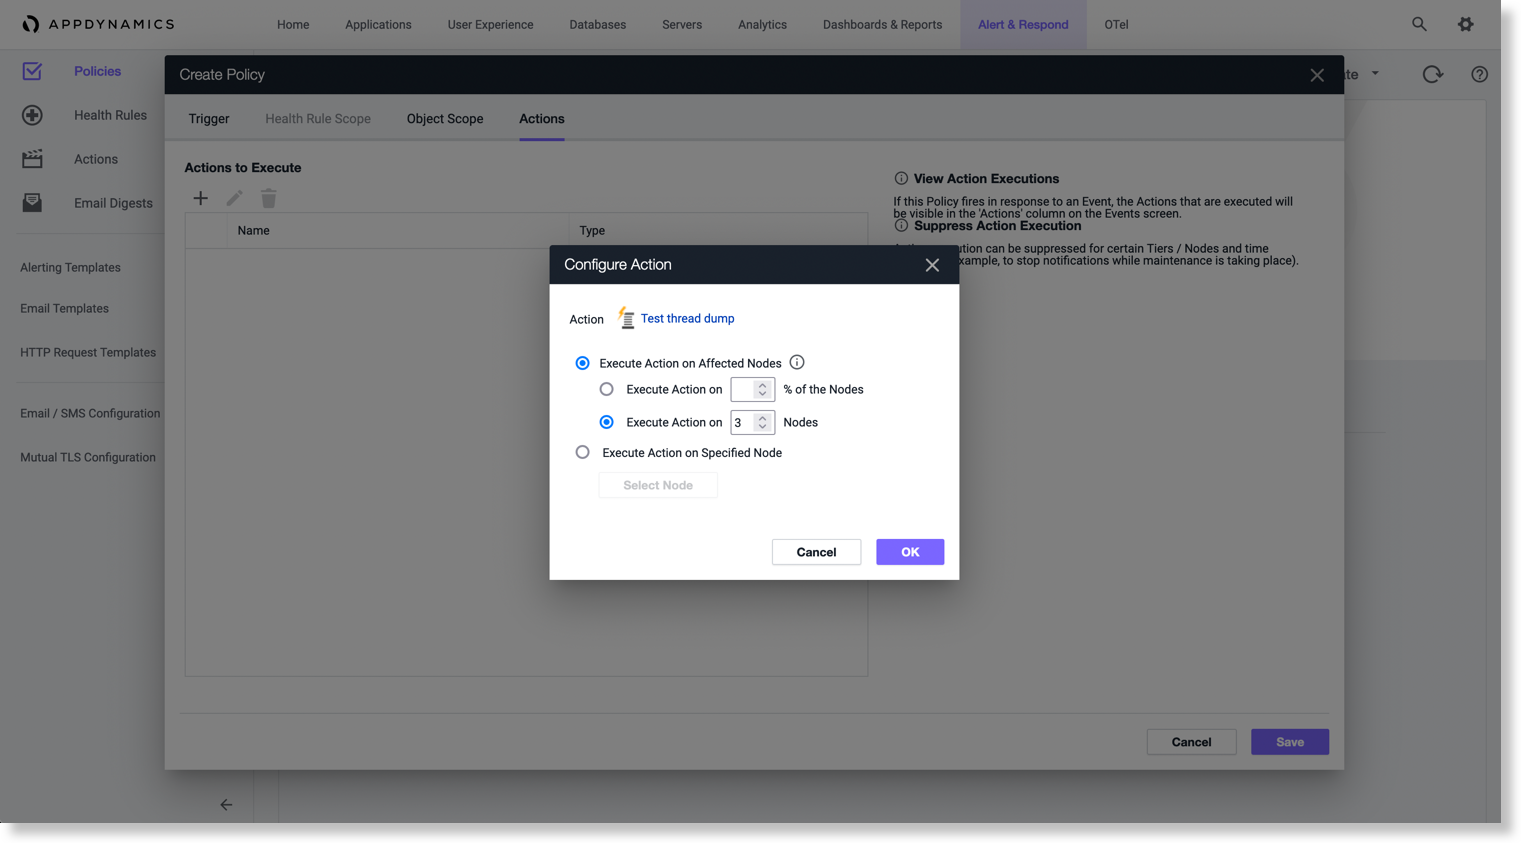
When you create a policy for Code Deadlock and then select a thread dump action, the following behavior occurs based on the action execution on the nodes:
- If the percentage input for the nodes is less than 100%, the affected nodes on which the action is executed is randomly selected. Even if the percentage is low, the action is executed on at least one affected node.
For example, if there are violations on five nodes, and the input percentage is 40%, AppDynamics randomly selects two nodes and executes the thread dump on them. Further, if there are violations on five nodes, and the input percentage is only 10%, AppDynamics still randomly selects one node and executes the thread dump on it.
- If there is an absolute input for the number of nodes, the affected nodes on which the action is executed is randomly selected.
For example, if there are violations on 5 nodes, and the input absolute value is 3, AppDynamics randomly selects 3 nodes and executes the thread dump on them.