Download PDF
Download page Monitor Cluster Health.
Monitor Cluster Health
The Cluster Dashboard provides visibility into your cluster's health to quickly determine any impact on performance. Each dashboard indicator corresponds to a different aspect of cluster performance.
Important Notes
The Cluster Inventory Dashboard may display 0 (zero) for Master Nodes; this is expected behavior. Unlike on-premises clusters, cloud providers develop and release at a different pace compared to the Kubernetes project and evolve independently. This master node, or a number of master nodes, in Amazon EKS, AKS, and other cloud-based environments or clusters, hides the master node of the cluster. The reported cluster results are similar to the results generated by the
kubectl get nodescommand. To verify your reported results, enter thekubectl get nodescommand to review node information, and if master nodes are shown as zero.- Cluster-level resource utilization metrics are the sum of resources consumed by each of the pods. These metric values may reach hundreds of thousands because the Cluster Agent reports sums for individual pods.
- Pod utilization metrics are the sum of each of the containers running within a pod.
- Pod count and pod state (running, pending, evicted, and failed pods) metrics show real-time values (not historical values averaged over a designated period of time). Whatever pods are running "now", are reported.
Clusters Dashboard
To access your cluster from the Controller:
- Select Servers > Clusters > Cluster Name.

- Select a Cluster Agent and double-click. The cluster interface displays the Dashboard, Pods, Inventory, and Events tabs.
Dashboard Tab

- Errors card:
 Displays pie chart graphs for the monitored namespaces in each cluster:
 - Errors: Number of Errors (Error events count), Evictions (Evicted pods count), and Threats (Eviction threats count) for individual pods.
- Pods by phase: Number of pods that are in various states: Failed, Pending, Running, Succeeded, and Unknown.
- Activity over period: Time-series chart that shows the number of pods in Running, and Pending states for a given time period.
- Cluster Capacity:
 Score bar displays CPU, Memory, and Pods. A green line indicates the capacity usage. The Dashboard indicates the percent usage of CPU, Memory, and Pod capacity of the cluster which you can use to plan the resource capacity for this cluster.
 - Issues card:
 Displays:
 - Pod issues: When a Cluster Agent observes pod restarts and errors.
- Image issues: Image pulling and errors.
- Storage: Storage capacity issues such as errors and quota violations.
- Utilization card:
 Displays:
 - CPU: Requests, limits, and used.
- Memory: Requests, limits, and used.
- PVCs: Requests and capacity.
- Quotas card:
 Displays % utilization of resources relative to the respective quotas. The Agent tracks these resources:
- Percentage of CPU Limit Quota Used.
- Memory Limit of Quota Used.
- Percentage of PVC Quota Used.
- Percentage of CPU Request Quota Used.
- Percentage of Memory Request Quota Used.
- Percentage of Storage Quota Used.
Numbers are cumulative for the entire cluster. Use these indicators to track the availability of specific resources based on the imposed quotas and use in cluster capacity planning.
Pods Tab
The Pods tab displays pods in various states and shares a high-level summary of their status. This example shows pods running in Amazon EKS. All pods are displayed based on their registered Namespace and Pod Name.
Terminated pods continue to display in the Pods list until they have been purged from the AppDynamics Controller, however, their metrics are not updated. Purging occurs automatically at regular intervals. See Administer the Cluster Agent.
The top card displays a summary of the monitored pods and their status in each cluster:
- Total Pods: Total number of pods in the monitored cluster.
- Running: Percentage and number of pods in a running state.
- Pending: Percentage and number of pods in a pending state. Pending status normally indicates an issue. See Kubernetes documentation.
- Evicted: Percentage and number of evicted pods.
- Failed: Percentage and number of failed pods.
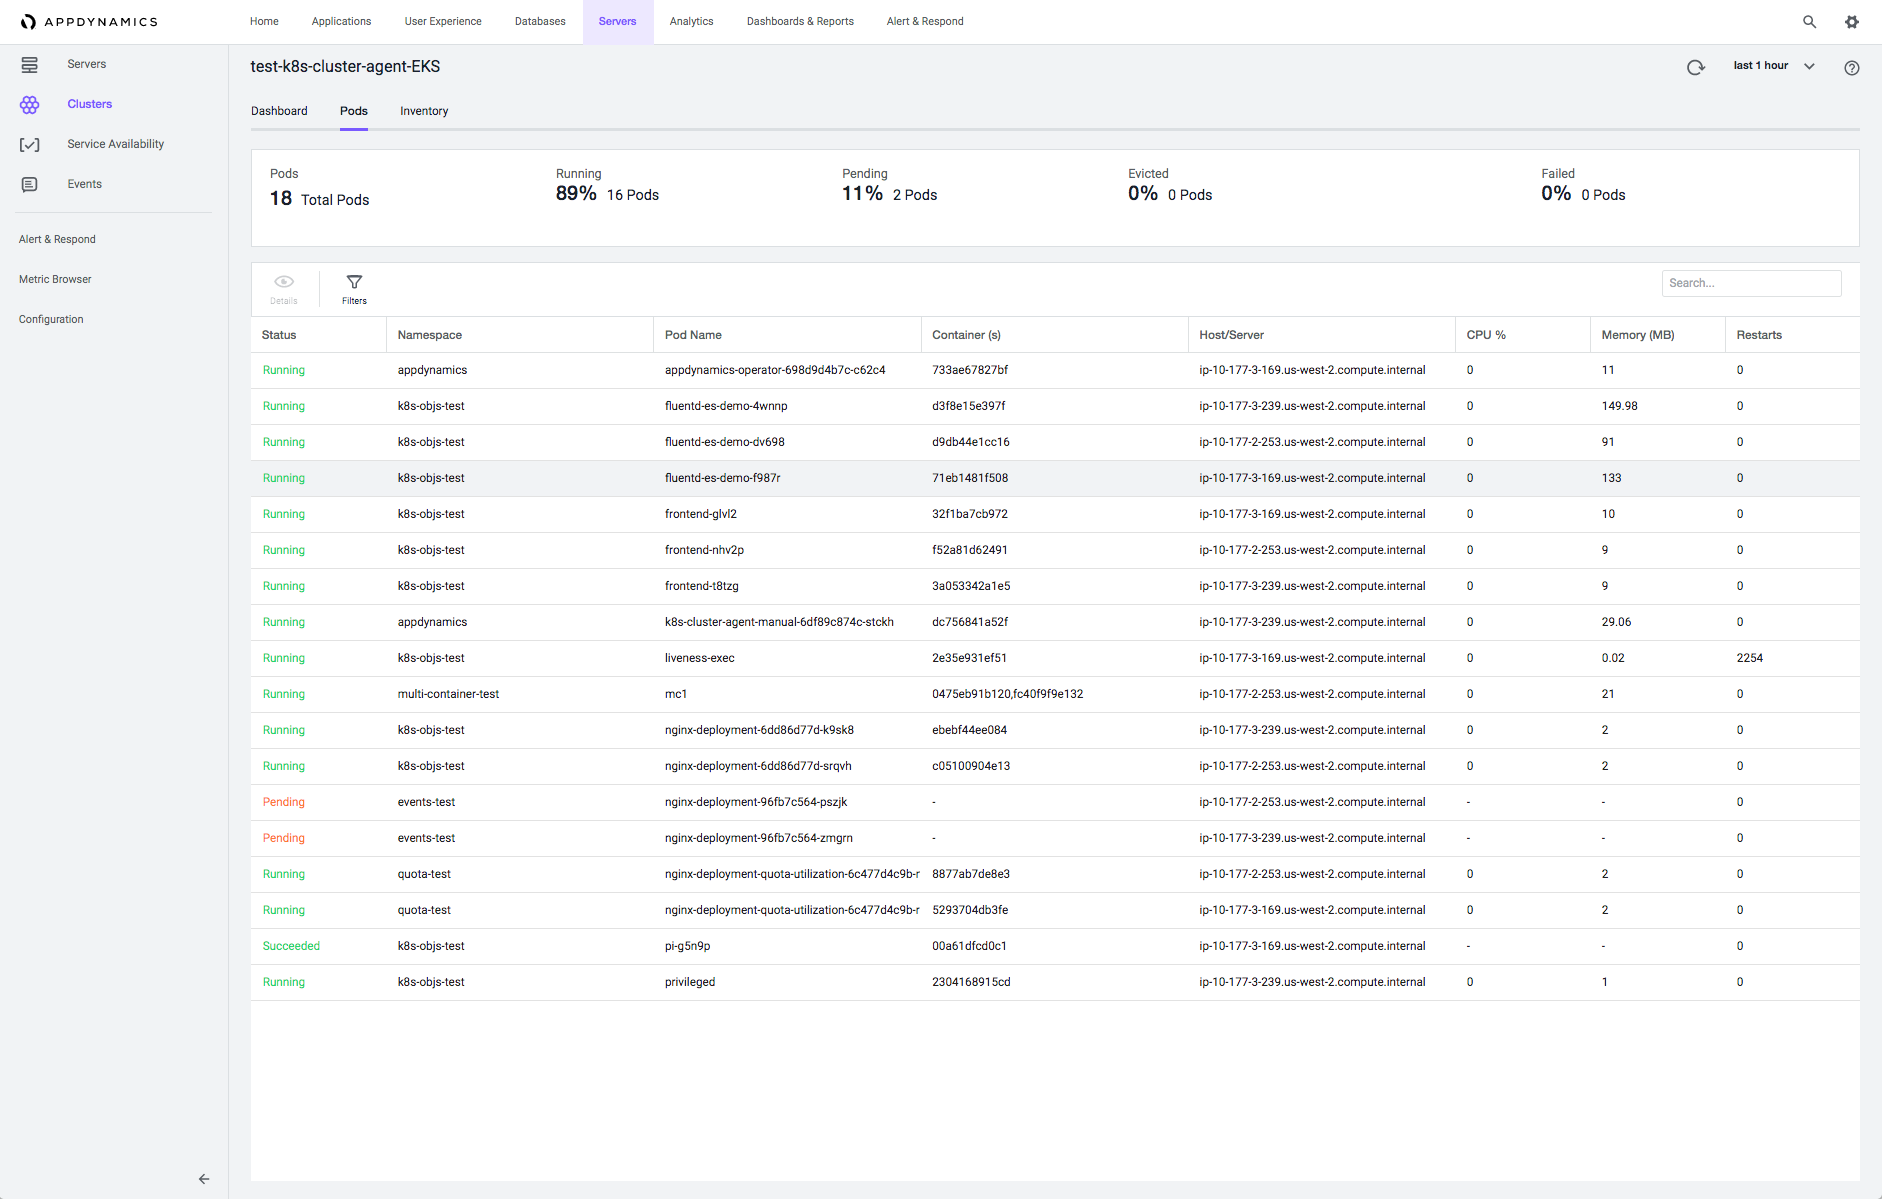
You can search based on Namespace or Pod Name.
You can further filter based on pod tags and labels: 
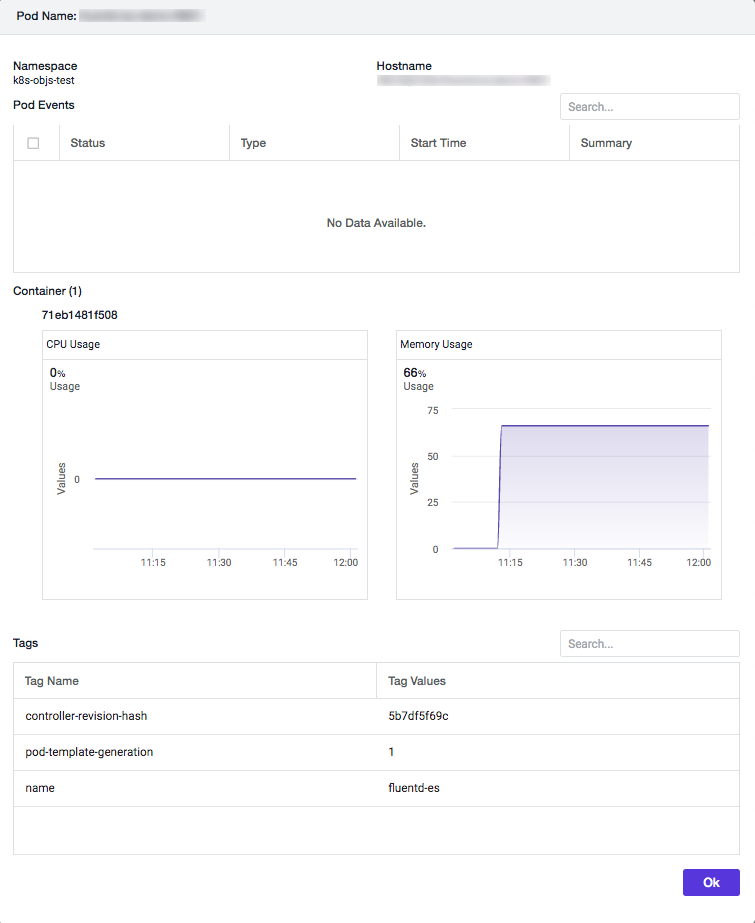
Double-click any pod to display its Pod Details panel. From the Pod Details panel, you can review containers running in that pod, pod events, and pod labels and tags.
The Cluster Agent automatically detects a pod's:
- Status
- Namespace
- Pod name
- Container IDs
- Host or server
- CPU % (sum of running containers within the pod)
- Memory MB (sum of running containers within the pod)
- Restarts
Pods are deleted for these reasons:
- When the namespace is un-monitored.
- When pods are deleted from the cluster, except for the failed pods.
- When the pod count exceeds the pod limit.
- If the pod is blocklisted.
Pod Details Panel
The Pod Details panel displays:
- Namespace: In which namespace the pod is running.
- Hostname: Namespace or pod name.
- Pod Events: List of the most-recent events generated from the
kubectldescribe podscommand. - Container (count): List of running containers displayed by Container ID in this pod. Click each container to display individual container metrics.
- Tags: Kubernetes labels provided to this pod.

If you click the Container ID, it expands to display two container metrics: CPU and Memory Usage.
Inventory Tab
The Inventory tab displays a high-level snapshot or inventory view of your cluster. It displays the contents of the cluster which enables you to troubleshoot applications running in the cluster.
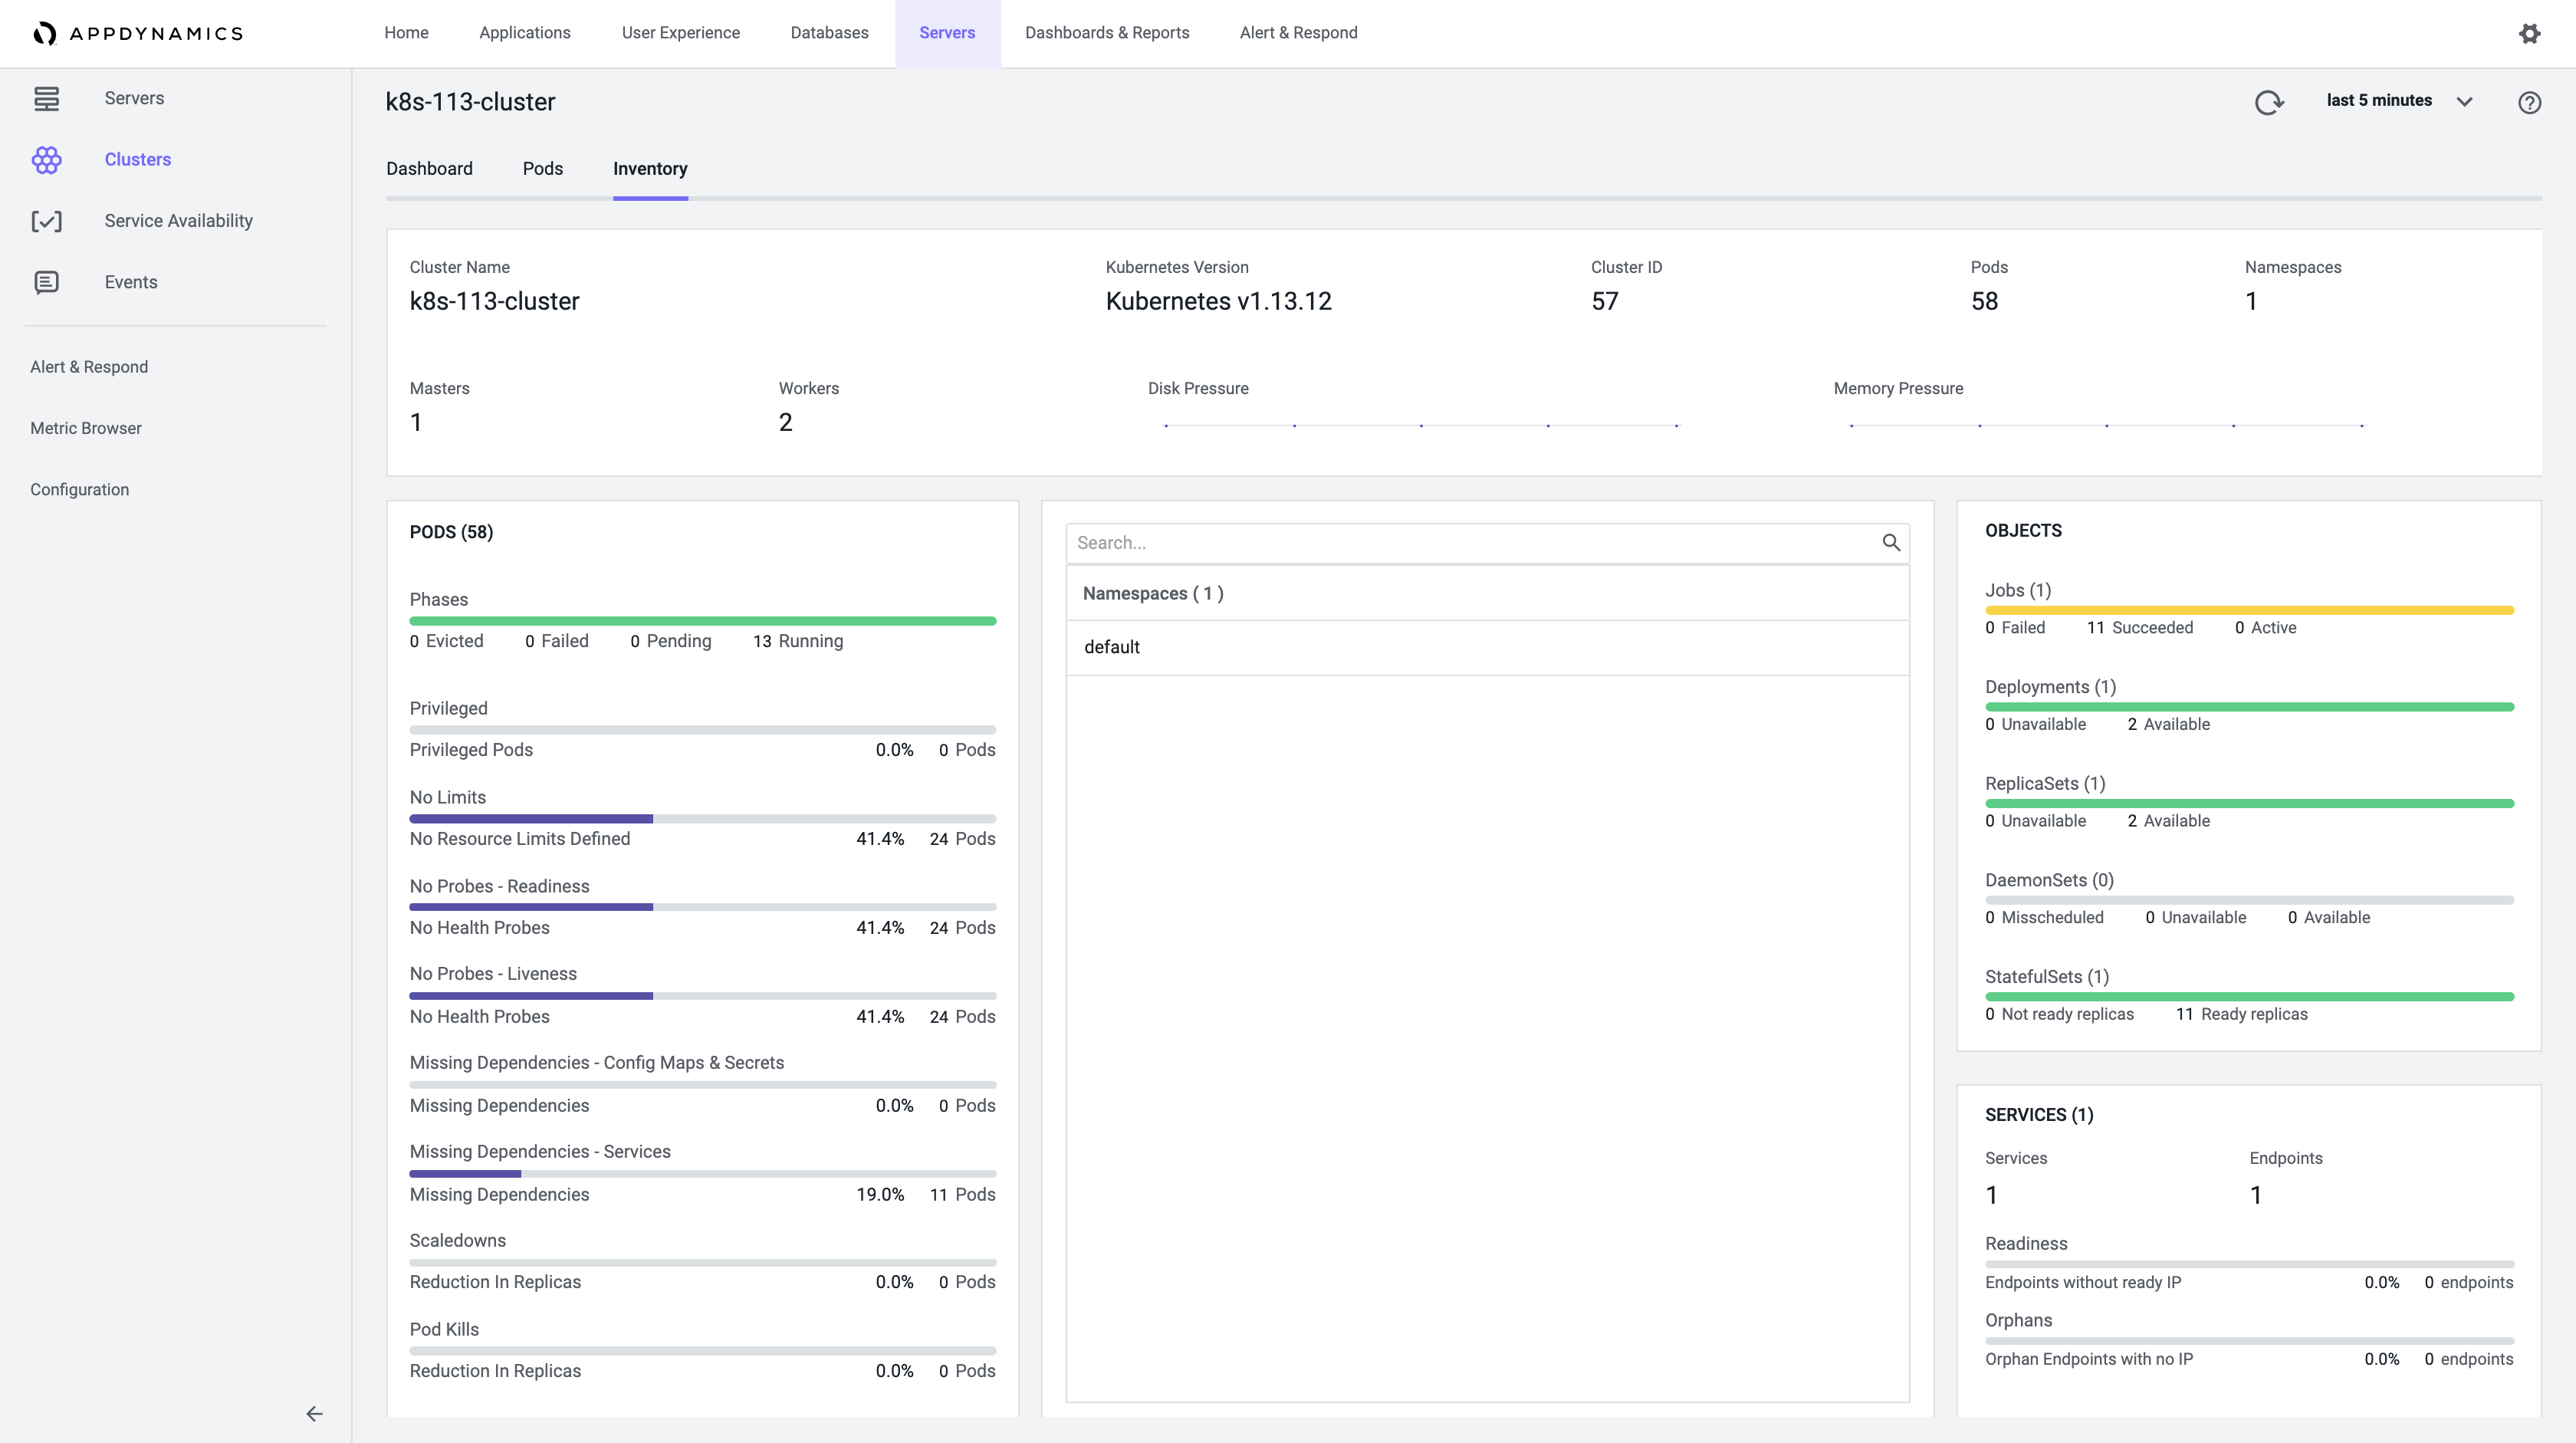
The Cluster card displays:
- Cluster Name: Name of the cluster.
- Kubernetes Version: Kubernetes version running on the cluster.
- Cluster ID: ID of the Cluster Agent.
- Pods: Number of monitored pods.
- Namespaces: Number of monitored namespaces.
- Masters: Number of master nodes.
- Workers: Number of worker nodes.
- Disk Pressure: Snippet of disk pressure trend in the cluster.
- Memory Pressure: Snippet of memory pressure trend in the cluster.
The Pods card displays:
- Pods by Phases: Whether a pod is running, evicted, pending or failed. This number is the same count as the pods in a "running" state in the Pods tab.
- Privileged Pods: The pods run as root.
- No Limits: You can specify limits to any pod that you are starting. The No Limits metric indicates how many pods do not have a limit defined.
- No Readiness Probe: If you configured a probe in Kubernetes to monitor readiness, the values display here.
- No Liveness Probe: If you configured a probe in Kubernetes to monitor liveness, the values display here.
- Missing Dependencies - Config Maps & Secrets: If a pod is dependent on any Config Maps & Secrets, then those dependencies are missing.
- Missing Dependencies - Services: If a pod is dependent on any Services, then those dependencies are missing.
- Scaledowns: Count of scaledowns of your deployments and replicasets.
- Pod Kills: Number of pods that were killed.
Namespaces: List of namespaces that you can search from the Search bar
The Objects card displays:
- Jobs: Total number of jobs in the monitored namespaces, and the number of failed, active, and succeeded job counts.
- Deployments: Number of deployments in monitored namespaces, and the total available and unavailable replica counts.
- ReplicaSets: Number of replicasets in monitored namespaces, and the total available and unavailable replica counts.
- DaemonSets: Number of daemonsets in monitored namespaces, and the total available, unavailable, and mis-scheduled pod counts.
- StatefulSets: Number of statefulsets in monitored namespaces, and the total ready and not ready replica counts.
The Services card displays the health of the entire cluster:
- Services: Total number of services being monitored.
- Endpoints: Total number of endpoints being monitored.
- Readiness: Number of endpoints without a ready IP address.
- Orphans: Number of orphaned endpoints with no IP address.
Events Tab
The Events tab displays the cluster events that are specific to the selected cluster. You can use Filters to view any specific event.
