You may notice objects in a Network Flow Map that do not show up in an Application Flow Map. This is because these Network Flow Map objects represent devices that are detected by the Network Agents, and are relevant to the monitored application, but the detected devices do not have Network Agents installed.
Load Balancers

Network Visibility detects load balancers (LB) automatically, and displays them in Network Flow Maps. Load balancers seek to optimize the distribution of network traffic and often hide internal IP addresses from external nodes. Application Flow Maps do not show load balancers because these devices do not function as application nodes.
An intermediate load balancer splits an application message into two separate connections: node A connection to a load balancer, and the load balancer connection to node B (node A -> LB, and LB -> node B). This additional layer of detail in the Network Browser makes it easier to identify network segments that have specific performance issues.
TCP Endpoints
The Controller uses TCP endpoints to represent flows where the monitoring vantage point is from one end. The Network Agent monitors the connection between a monitored node and a TCP endpoint. However, the Network Agent cannot determine if this endpoint is on another node, or on an intermediate device (such as a load balancer) that splits the connection in two.
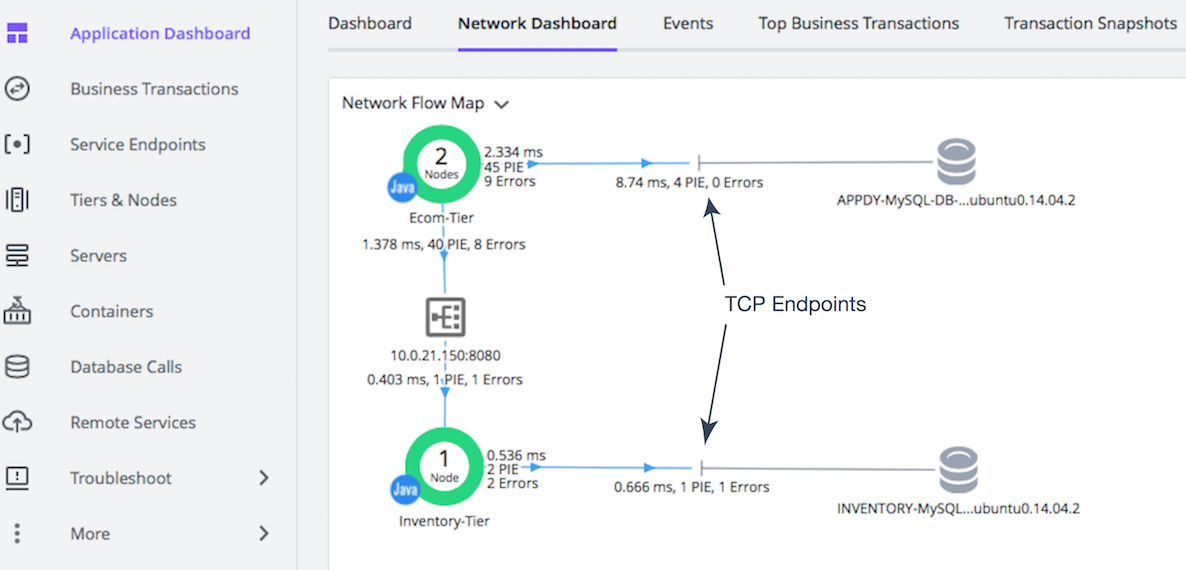
These diagrams show two different views of the same application:
The Application Dashboard shows two tiers connecting to two MySQL instances. The Application Flow Map shows application messages between monitored nodes that are directly visible to App Agents. | |
The Network Dashboard shows TCP endpoints on links between tiers and nodes. The Network Flow Map shows Network Agents installed (left) and nodes that the Network Agents cannot see directly (right). | |
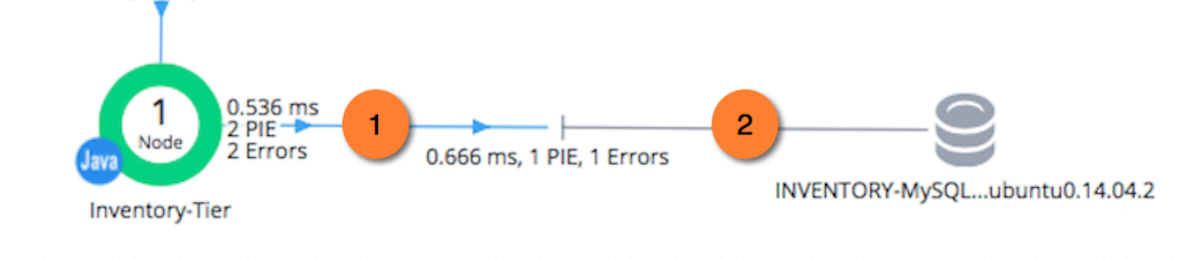
This example shows how a Network Agent monitors a connection between an Inventory-Tier node (left), and an Inventory Database service. A TCP endpoint divides the link into:
 A colored line representing the connection visible to the Network agent, and
 A gray line representing a connection that is not instrumented by Network Visibility. A gray line connection link without Network Visibility indicates one of two things:
- The TCP endpoint and an Inventory Database service are on the same device with an intermediate device that splits the connection in two.
- The TCP endpoint and an Inventory Database service are on two devices using a separate connection that does not allow for network visibility.
For these reasons, gray line connection links do not have associated metrics.