The Ajax Dashboard is divided into three areas:
- A summary, with a waterfall graph of the entire load sequence. To see details for each set of data, use the Trends/Details checkboxes.
- Two sections of Trends/Details across time for the main performance categories:
- Overall performance
- Time used by the server to process the request through the browser's incorporation of the data into the HTML document
Ajax Dashboard Summary Section
This section provides a quick overview of the item's performance over time.
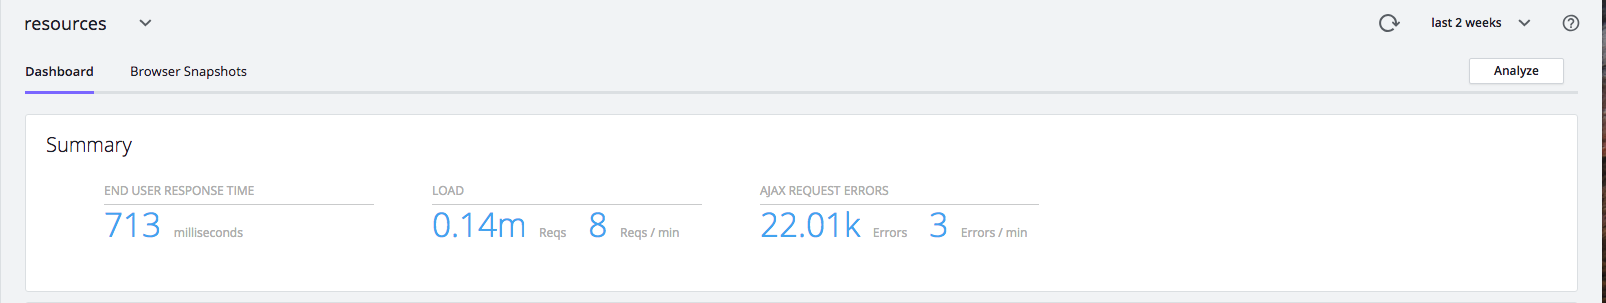
Key performance indicators—End User Response Time, Load, Cache Hits and Views with Errors—across the period selected in the timeframe dropdown from the upper-right side of the GUI—are displayed across the top of the summary area.
A waterfall graph displays the average times needed for each aspect of the Ajax request load process.
For more information on what each of the metrics measures, hover over its name on the left side of the graph. A popup appears with a definition. See the graphic above for an illustration. See Browser RUM Metrics.
To see detailed breakouts of the data behind the graph, check the Trend/Detail checkbox by the data group in which you are interested.
Timing Breakdown
A waterfall graph shown below displays the average times needed for each aspect of the Ajax request. For more information on what each of the metrics measures, hover over its name on the left. A popup appears with a definition. See Browser RUM Metrics.

To see detailed breakouts of the data behind the graph, check the Trend/Detail checkbox by the data group in which you are interested. To turn off details, uncheck the checkbox.
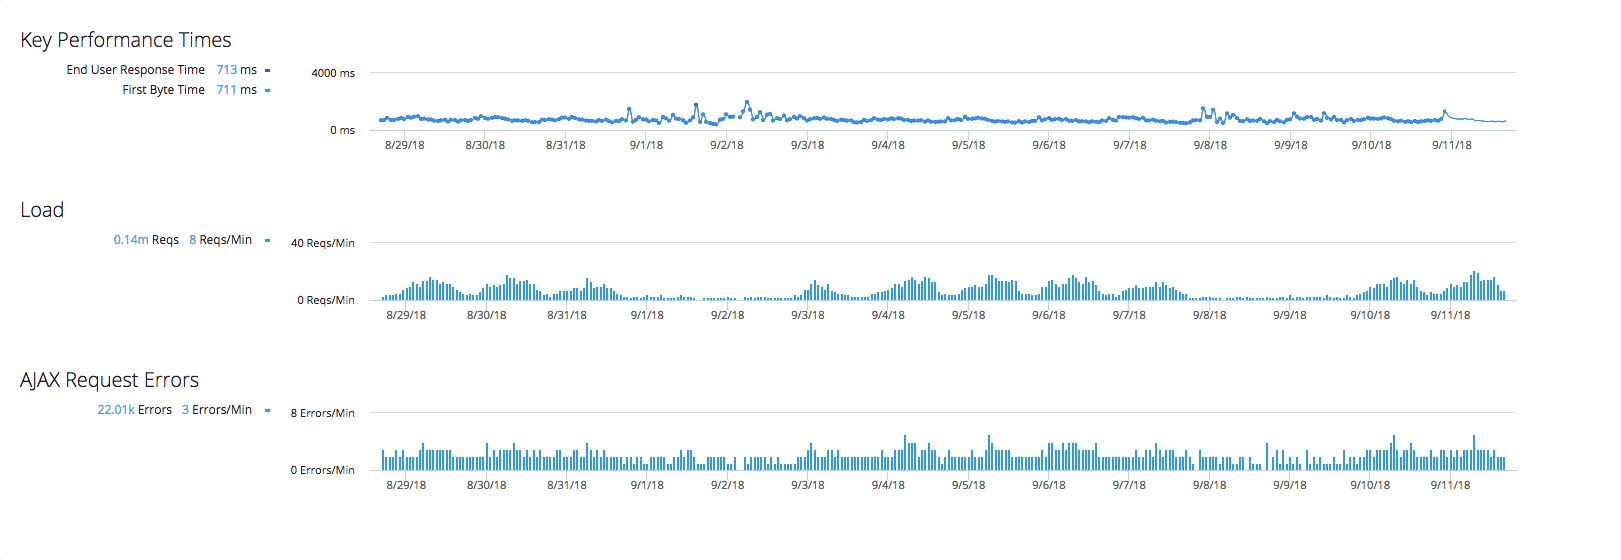
This section displays detailed trend graphs of key performance metrics, load requests, and Ajax request errors measured across the selected timeframe. To see detailed information for a particular moment, hover over the graph and a popup with that information appears. To see any of the listed total metrics in the context of the metric browser, click the desired value (shown in link-blue) on the left side of the panel. The metric browser appears, with that metric displayed. You can then use the metric browser to compare other related values in one display.
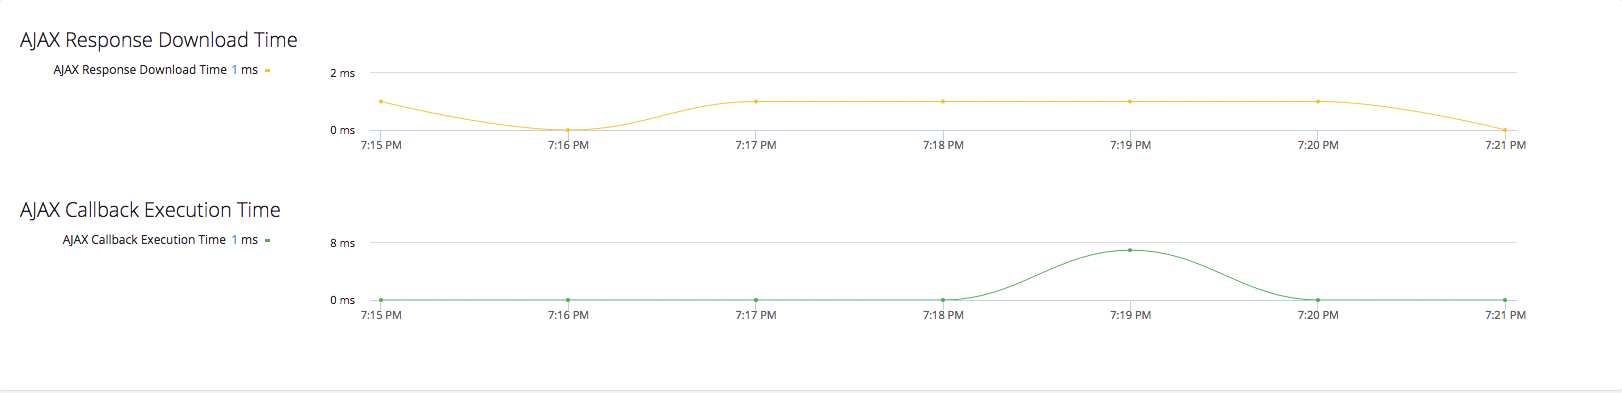
Ajax Response Download and Ajax Callback Execution Time
This section displays detailed trend graphs of the Ajax response download time and the Ajax callback execution time. To see detailed information for a particular moment, hover over the graph to view a popup.
These metrics measure the total time for processing all server-side business transactions for this item.