Download PDF
Download page Instrument Applications with AppDynamics for OpenTelemetry™.
Instrument Applications with AppDynamics for OpenTelemetry™
If you have an application that is monitored with AppDynamics Java, .NET, or Node.js Agents, you can instrument AppDynamics agents in your application to report both OpenTelemetry span data and Application Performance Monitoring (APM) data. When instrumented, the agents will generate OpenTelemetry span data from HTTP entry and exit requests. The AppDynamics correlation header is injected inside the OpenTelemetry baggage header, which results in the correlation with Business Transactions through intersecting OpenTelemetry nodes.
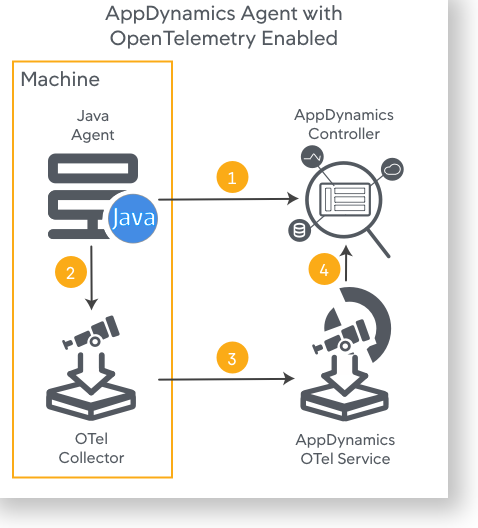
For example, the diagram above demonstrates how OpenTelemetry data is reported when an AppDynamics Java Agent is enabled for OpenTelemetry. The Java Agent sends APM data to the AppDynamics Controller and OpenTelemetry spans to the OpenTelemetry Collector. The Collector then sends the received spans to the AppDynamics OpenTelemetry Service via OTLP/HTTP(s). The AppDynamics OpenTelemetry Service consolidates the spans into traces and maps traces to Business Transactions that are registered with the Controller. The Controller UI displays both the APM data from the AppDynamics Agent and the OpenTelemetry data from the AppDynamics OpenTelemetry Service.
Before You Begin
Make sure you have deployed and configured the OpenTelemetry™ Collector and configured the resource attributes.
Enable OpenTelemetry in the Java Agent
To enable the Java Agent for OpenTelemetry, you need Java Agent version >= 21.11.4 (we recommend using Java Agent version >= 22.3.0). For a list of Java frameworks supported for OpenTelemetry, see Supported Java Agent Frameworks for OpenTelemetry.
Add the following system properties in your JVM system properties:
Enable OpenTelemetry:
-Dappdynamics.opentelemetry.enabled=trueCODESet the traces exporter to OTLP (the OpenTelemetry-enabled Java Agent will send OpenTelemetry spans in the OTLP format):
-Dotel.traces.exporter=otlpCODESet the tier name (in
service.name) and application name (inservice.namespace) for the JVM:
If you do not set the tier name in
service.name, the value defaults to the tier name originally registered by the .NET Agent (when the tier was first instrumented by AppDynamics).-Dotel.resource.attributes="service.name=myServiceName,service.namespace=myServiceNameSpace"CODEYou also have the option to set tier and application names in your OpenTelemetry
otel-config.ymlfile or in theOTEL_RESOURCE_ATTRIBUTESenvironment variable. See Set service.name and service.namespace to Your Application and Tier Names.
(Optional) Configure the Collector Endpoint
By default, the collector endpoint points to http://localhost:4317 but can be optionally configured in property Dotel.exporter.otlp.traces.endpoint:
-Dotel.exporter.otlp.traces.endpoint=http://localhost:8080(Optional) Configure the Batching Timing
The default exporter span batching schedule is 5000 milliseconds. The batching schedule can be configured with the OpenTelemetry environment variable OTEL_BSP_SCHEDULE_DELAY:
-Dotel.bsp.schedule.delay=90000Java Instrumentation Sample
-Dotel.traces.exporter=otlp
-Dotel.resource.attributes="service.name=myServiceName,service.namespace=myServiceNameSpace"
-Dappdynamics.opentelemetry.enabled=true
-Dappdynamics.controller.hostName=sample-controller.e2e.appd-test.com
-Dappdynamics.controller.port=443
-Dappdynamics.agent.accountName=OTEL-account
-Dappdynamics.agent.accountAccessKey=3ea55405-61b2-43bb-a8e0-58aff761a028
-Dappdynamics.controller.ssl.enabled=true
-Dappdynamics.agent.applicationName=ecommerce_OT
-Dappdynamics.agent.uniqueHostId=ecommerce_OT_1
-Dappdynamics.agent.tierName=DownTier
-Dappdynamics.agent.nodeName=DownNode
-javaagent:/<Java Agent Jar Path>/javaagent.jarEnable OpenTelemetry in the .NET Agent
To enable the .NET Agent for OpenTelemetry, you need:
- .NET Agent version >= 22.6.0
- Applications using .NET version >= 6.0
- For a list of .NET frameworks supported for OpenTelemetry, see .NET Agent Frameworks for OpenTelemetry.
Add the following environment variable in the process that executes your .NET application:
Enable OpenTelemetry:
APPDYNAMICS_OPENTELEMETRY_ENABLED=trueCODESet the trace exporter to OTLP (the OpenTelemetry-enabled .NET Agent will send OpenTelemetry spans in the OTLP format):
OTEL_TRACES_EXPORTER=otlpCODESet the tier name (in
service.name) and application name (inservice.namespace) for the application:
If you do not set the tier name in
service.name, the value defaults to the tier name originally registered by the .NET Agent (when the tier was first instrumented by AppDynamics).OTEL_RESOURCE_ATTRIBUTES=service.name=myServiceName,service.namespace=myServiceNameSpaceCODEYou also have the option to set tier and application names in your OpenTelemetry
otel-config.ymlfile. See Set service.name and service.namespace to Your Application and Tier Names.
(Optional) Configure the Collector Endpoint
By default, the collector endpoint is set to http://localhost:4318 and sends metrics via HTTP using OTLP format. The .NET Agent for OpenTelemetry does not support sending metrics via gRPC.
The endpoint can be configured with the environment variable OTEL_EXPORTER_OTLP_ENDPOINT:
OTEL_EXPORTER_OTLP_ENDPOINT=http://otel-collector:8080(Optional) Configure Batching timing
The default exporter span batching schedule is 5000 milliseconds. The batching schedule can be configured with the environment variable OTEL_BSP_SCHEDULE_DELAY:
OTEL_BSP_SCHEDULE_DELAY=90000.NET Instrumentation Sample
...
APPDYNAMICS_OPENTELEMETRY_ENABLED=true
OTEL_TRACES_EXPORTER=otlp
OTEL_EXPORTER_OTLP_ENDPOINT=http://otel-collector:4318
OTEL_RESOURCE_ATTRIBUTES=service.name=myServiceName,service.namespace=myServiceNameSpace
...Enable OpenTelemetry in the Node.js Agent
To enable OpenTelemetry in the Node.js Agent, you need Node.js Agent version >= 22.3.0.
Add the following OpenTelemetry configurations in your Node.js application code:
Enable OpenTelemetry in the
requirestatement:
For Node.js applications, OpenTelemetry AppName and TierName is derived from the
AppNameandTierNamein the Node.jsrequirestatement. If your AppDynamics application/tier is namedMY_APP/MY_TIER, your OpenTelemetry application/tier will beMY_APP_OTEL/MY_TIER_OTEL.require("appdynamics").profile( { ... openTelemetry: { enabled: <True:False> // openTelemetry is enabled or disabled } ... } )JSAllow additional logging of span data:
require("appdynamics").profile( { ... openTelemetry: { debug: <True:False> // Additional logging, console dump of span data ... } ... } )JSAdd the OpenTelemetry Collector URL:
require("appdynamics").profile(
{
  ...
  openTelemetry: {
	collector: {
		url: <url> <http://host:port/v1/traces> // The default value is http://localhost:55680/v1/traces
	}
  ...
 }
)
JS
(Optional) Configure the Batching Timing
require("appdynamics").profile(
{
  ...
  openTelemetry: {
    exporter: {
      maxQueueSize: size_in_byte  the maximum queue size. After the size is reached spans are dropped. The default value is 2048.
      scheduledDelayMillis: time_in_ms the delay interval in milliseconds between two consecutive exports. The default value is 5000.
	}
 	...
  }
}
)Node.js Instrumentation Sample
require("appdynamics").profile(
{
  ...
  openTelemetry: {
    enabled: <True:False> // OpenTelemetry enabled or disabled
    debug: <True:False> // Additional logging, console dump of span data
    collector: {
       url: <url> <http://host:port/v1/traces> // The default value is http://localhost:55680/v1/traces
     }
  }
  ...
}
)Instrument Ruby Application Using OpenTelemetry
The following diagram demonstrates how OpenTelemetry data of a Ruby application is ingested into AppDynamics:
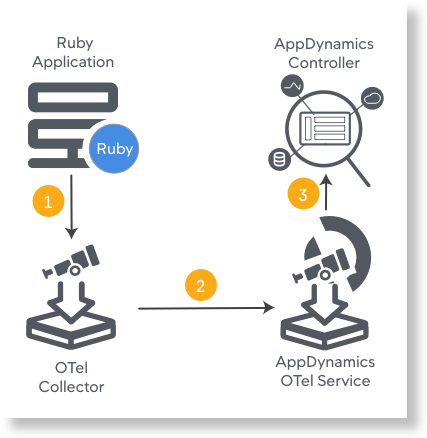
The Ruby application sends the OpenTelemetry spans to the OpenTelemetry Collector. The Collector then sends the spans to the AppDynamics OpenTelemetry Service via OTLP/HTTP(s). The AppDynamics OpenTelemetry Service consolidates the spans into traces and maps traces to Business Transactions that are registered with the Controller. The Controller UI displays the OpenTelemetry data from the AppDynamics OpenTelemetry Service.
Configure Ruby Application
The following procedures provide brief instructions to configure a Ruby application. For more details, see OpenTelemetry for Ruby.
You can instrument the Ruby application using OpenTelemetry in one of the following ways:
Automatic Instrumentation is the recommended instrumentation method.
Automatic Instrumentation
The opentelemetry-sdk and opentelemetry-instrumentation-all packages populate the traces/spans automatically with minimal manual effort.
For the list of supported frameworks, see Supported Framework.
The following procedure is an example of instrumenting a simple Ruby On Rails application:
Add the following packages to the existing Gemfile.
Gemfile
gem 'opentelemetry-sdk' gem 'opentelemetry-exporter-otlp' gem 'opentelemetry-instrumentation-all'RUBYConfigure the Ruby application to initialize OpenTelemetry. Create a
<project>/config/initializers/opentelemetry.rbfile.config/initializers/opentelemetry.rb
# config/initializers/opentelemetry.rb require 'opentelemetry/sdk' require 'opentelemetry/exporter/otlp' require 'opentelemetry/instrumentation/all' OpenTelemetry::SDK.configure do |c| c.resource = OpenTelemetry::SDK::Resources::Resource.create({ OpenTelemetry::SemanticConventions::Resource::SERVICE_NAMESPACE => '<YOUR_SERVICE_NAMESPACE>', # corresponds to Appd controller Application name OpenTelemetry::SemanticConventions::Resource::SERVICE_NAME => '<YOUR_SERVICE_NAME>' # corresponds to Appd controller Tier name }) c.use_all() # enables all instrumentation! endRUBYConfigure the application to report traces to the OpenTelemetry Collector. Set up the
OTEL_EXPORTER_OTLP_ENDPOINTenvironment variable on which the OpenTelemetry Collector listens to:env
export OTEL_EXPORTER_OTLP_ENDPOINT=http://0.0.0.0:4318RUBY
0.0.0.0is the OpenTelemetry collector HOST and4318is the OpenTelemetry Collector PORT. For more information about available exporters, see Ruby Exporter.Install the newly added Gems to Gemfile.
bundle installCODE- Start the Ruby application.
Manual Instrumentation
Use the manual instrumentation method only if there is no framework support.
Add the following packages to the existing Gemfile.
Gemfile
gem 'opentelemetry-sdk' gem 'opentelemetry-exporter-otlp'RUBYAdd the following lines to create spans manually. For example, you can create spans to instrument a Ruby script or an unsupported framework.
code snippet
require 'opentelemetry/sdk' require 'opentelemetry/exporter/otlp' OpenTelemetry::SDK.configure def hello_world tracer_provider = OpenTelemetry.tracer_provider tracer = tracer_provider.tracer('hello world') tracer.in_span("hello_world", kind: :server) do |span| puts "Hello all" # Do something... expensive/simple task that you want to instrument end tracer_provider.shutdown end hello_worldRUBYSet up the
OTEL_EXPORTER_OTLP_ENDPOINTenvironment variable on which the OpenTelemetry Collector listens to:env
export OTEL_EXPORTER_OTLP_ENDPOINT=http://0.0.0.0:4318RUBY
0.0.0.0is the OpenTelemetry collector HOST and4318is the OpenTelemetry Collector PORT. For more information about available exporters, see Ruby Exporter.Install the newly added Gems to Gemfile.
bundle installCODE- Start the Ruby application.
Enable OpenTelemetry for NGINX Server
OpenTelemetry Collector
Add the AppDynamics configuration to the OpenTelemetry Collector service.
The following snippet is a sample configuration file. See Configure Collector for more details about OpenTelemetry Collector.
otel-config.yaml
# otel-config.yaml
processors:
  batch:
  memory_limiter:
  resource:
    attributes:
      - key: service.namespace
        action: upsert
        value: "xxx"
      - key: appdynamics.controller.host
        value: "xxx"
        action: upsert
      - key: appdynamics.controller.port
        value: xxx
        action: upsert
      - key: telemetry.sdk.name
        value: "xxx"
        action: upsert
      - key: appdynamics.controller.account
        value: "xxx"
        action: upsert

receivers:
  otlp:
    protocols:
      grpc:
      http:
        cors_allowed_origins:
          - http://*
          - https://*

exporters:
  otlphttp:
    endpoint: "https://<your-region>-sls-agent-api.saas.appdynamics.com"
    headers: { "x-api-key": "xxxxxx" }

  logging:
    loglevel: debug

service:
  pipelines:
    traces:
      receivers: [otlp]
      processors: [batch, resource]
      exporters: [otlphttp, logging]
AppDynamics Controller
The following screenshots show the Ruby application dashboard on the AppDynamics Controller:
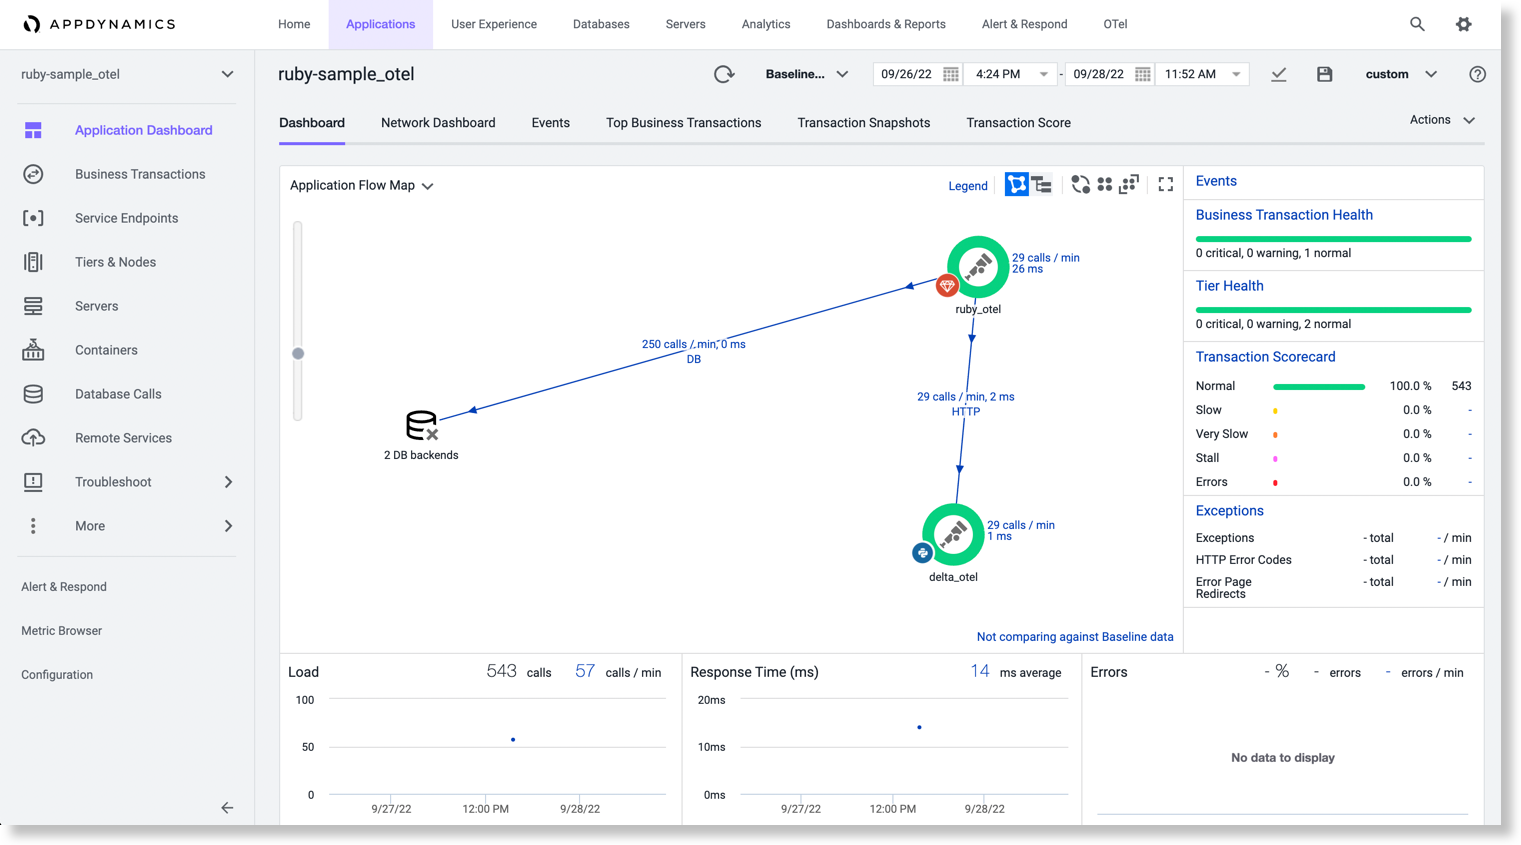
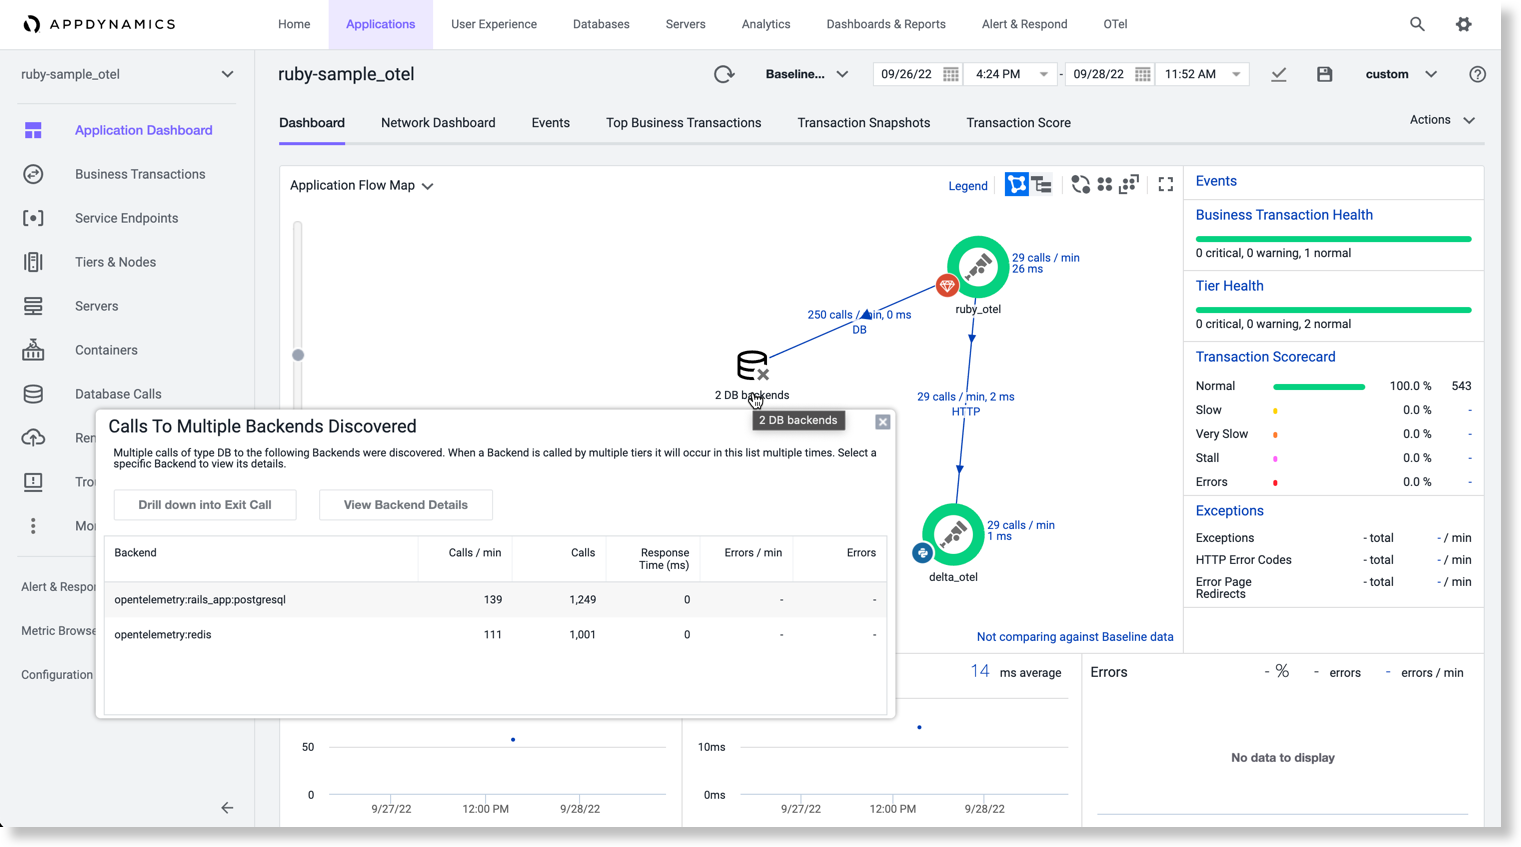
For applications that use OTel SDK only or OTel SDK and updated agents (Java >=21.11, .NET >=22.6, and Node.js >=22.3), you can view the end-to-end flow in the OTel flow map view. For mixed environments or older agents, you may need to use the All Sources flow map view, which includes flows discovered using both traditional APM and OTel. For more details, see View OpenTelemetry™ Data in the Controller UI.
Next Steps
Once you have instrumented your applications with AppDynamics for OpenTelemetry, you can view OpenTelemetry data in the Controller.
OpenTelemetry™ is a trademark of The Linux Foundation®.