Download PDF
Download page Configure Custom Metrics.
Configure Custom Metrics
Database Visibility extends monitoring by specifying SQL queries to run on the monitored database and the queries run during normal database activity. You can schedule these custom queries to run on regular intervals and collect the results in a custom metric. See Database Custom Metrics Window.
To specify custom queries to run:
- Navigate to Configuration > Custom Metrics > New.
- Complete the following fields:
- Name: The name you want to name your custom metric. Once you create a custom metric/event, you cannot change its name.
- Custom Query Metric Type: The type of result that you want from the query.
Select the Metric type to generate metrics for which health rules can be defined. Metrics of this type are displayed in the Metric Browser or in the Custom Metrics tab of each collector.
- Select the Event Data type to generate custom events whenever the custom query output is non-empty. If you want to be notified when a custom event occurs, you can create a policy that is triggered by that custom event. Custom events are displayed in the Events tab. If the custom query outputs multiple rows, the first 40 rows will be included in the event details. Each row displays a maximum of 5000 characters, including the column separators (|).
- Database Type: The database platform that you want to run the metric on.
- Databases: The database instances that you want to run the metric on. You can run the metric on all database instances of the specified database type, or on specific database instances that you specify.
Schedule: The time interval at which you want to run the query. For metric type custom queries, the metric value reported in between the specified intervals is the value observed in the previous query execution.
The timeout for configured custom metric depends on the frequency of running the query. This table provides the timeout details based on the time interval:Interval (minutes) Timeout (seconds) 1
10 5 15 10 30 30 60 60 120 360 180 720 300 1440 300 - Query Text: The query that you want to execute. If you are creating a custom metric of Metric type, its query must have one of the following return types:
Positive integer. For example, the query below returns a positive integer.
SELECT COUNT(*) FROM employeesCODEString and positive integer. For example, the query below returns a string and a positive integer.
SELECT name, salary FROM employeesCODE
Custom queries appear for all collectors, but the data only reflects the collector that you created it for. You can test the semantics of the query and also validate the results by clicking the Test Query button.
Custom query results are validated if the Database Agent >= 4.5.5.
The following points provide information about using limits when configuring custom metrics:
- The total number of custom metrics or events that you can create per account is the product of
total number of Collectorsanddbmon.config.max.custommetric.By default, the value ofdbmon.config.max.custommetricis 40. You can adjust the limit up to 150 using thedbmon.config.max.custommetricproperty in the Controller Settings. - Up to 150 custom metrics can be reported per collector per minute.
- You can increase the custom metrics limit from the agent configuration properties by using the key,
dbagent.custom.metric.reportable.per.serverand theMaxvalue 150. See Database Agent Configuration Properties for information about the key value. - The maximum limit configured in the agent takes precedence and overrides the maximum limit configured at the account level and Controller level. Therefore, the priority order is as following:
- Agent-level configuration
- Account-level configuration
- Controller-level configuration
Custom metrics are supported for all relational databases: MySQL, Microsoft SQL Server, Oracle, PostgreSQL, DB2, and Sybase.
View Custom Metrics
You can view your custom metrics in the following locations:
- In Databases > Metric Browser, expand the database that you want to view custom metrics for.
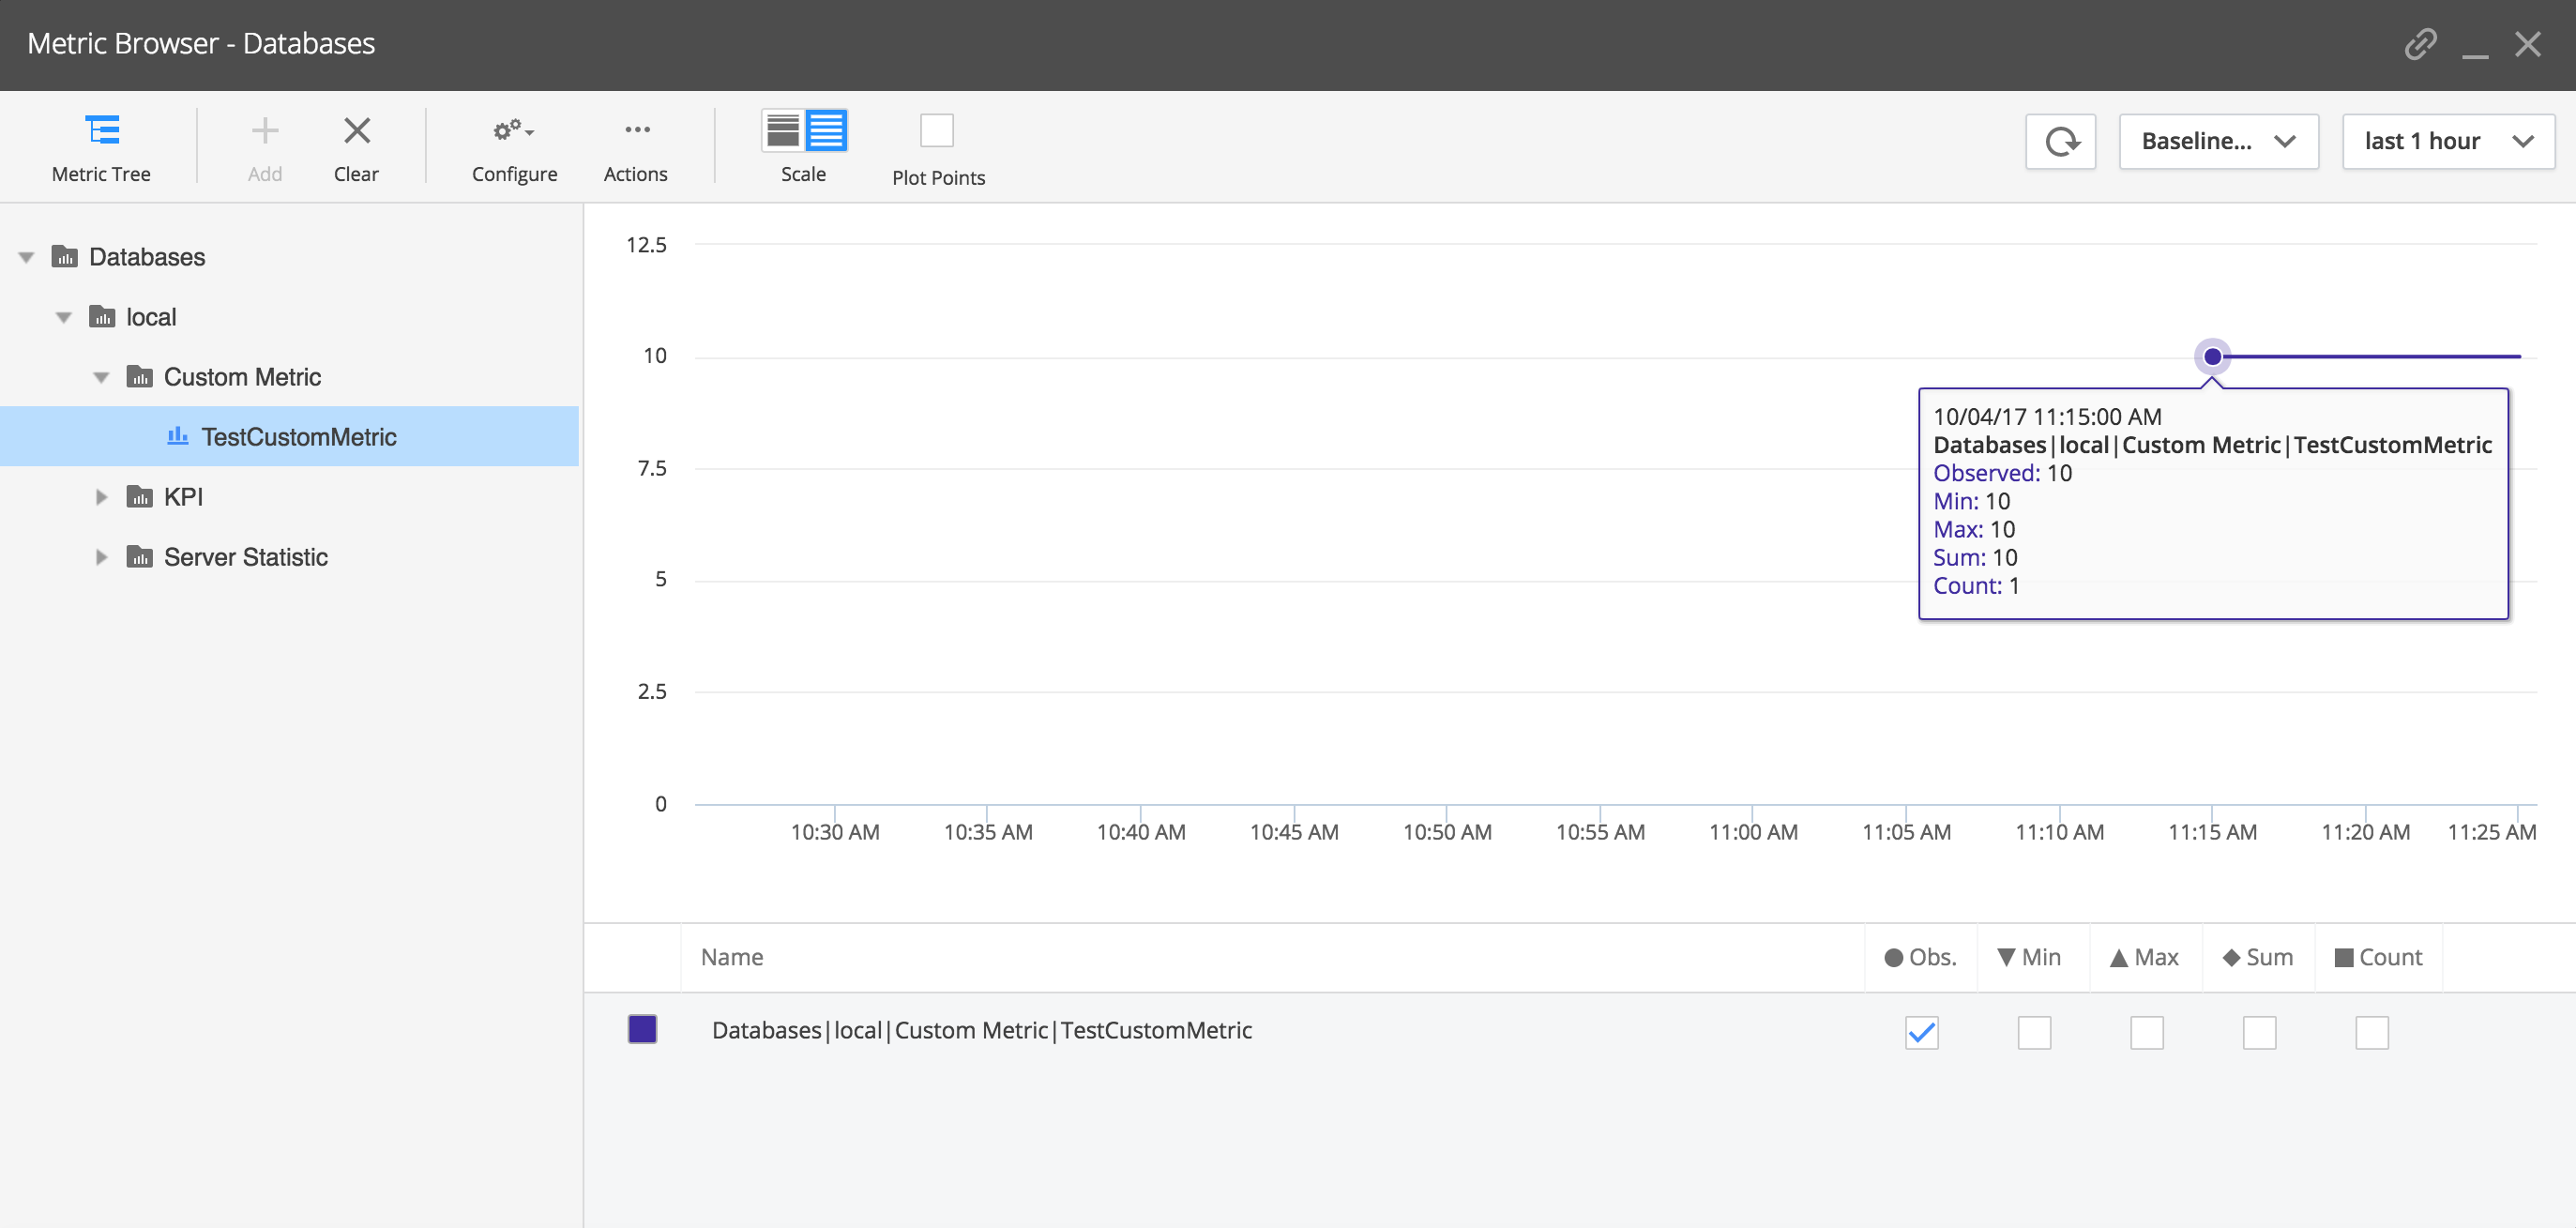
- In Databases, open a database instance and click the Custom Metrics tab.
