Download PDF
Download page Slow Response Times.
Slow Response Times
You may receive a notification based on a health rule violation, see performance indicators in flow maps or transaction scorecards that indicate slow response times. When you do, the following guidelines provide a strategy for troubleshooting and diagnosis.
The Slow Response Times Dashboard in the Troubleshoot menu lists the Business Transactions most responsible for slow Average Response Time (ART). From that dashboard, you can select a time range centered around a spike in ART that also captures more normal-looking time spans. This information is also available through the Top Business Transactions tab on the By Contribution to App Average Response Time tile.
Step 1: Check for slow or stalled business transactions.
AppDynamics uses transaction thresholds to detect slow, very slow, and stalled transactions. Follow these steps to determine if you complete Step 2 or move on to Step 3.
Do you have slow or stalled transactions?
- Make sure that the time frame selected in the Controller UI encompasses the time when the performance issue occurred. If it's a continuing condition, you can keep the time frame relatively brief. Use the Time Range dropdown.
- Click Troubleshoot > Slow Response Times.
- Click the Slow Transactions tab if it is not already selected.
- Do you see one or more slow transaction snapshots on this page?
Step 2: Drill into slow or stalled transactions to determine the root cause.
From the left menu, navigate to Troubleshoot > Slow Response Times.
In the lower pane of the Slow Transactions tab, click the Exe Time (ms)
 column to sort the transactions from slowest to fastest.
- Select a snapshot from the list and click Details
 .
. - Review the Potential Issues list to see the longest-running method and SQL calls in the transaction.
- Click a potential issue and select Drill Down into Call Graph to go directly to that point in the call graph, or click Drill Down in the transaction flow map pane to see the complete set of call graph segments retained for this transaction.

- View the Time (ms) column to see how long this method execution takes relative to the transaction execution time.
- Click the HTTP link in the last column on the right to display the information details pain. In this example, the selected method is taking 96.3% of the transaction execution time.
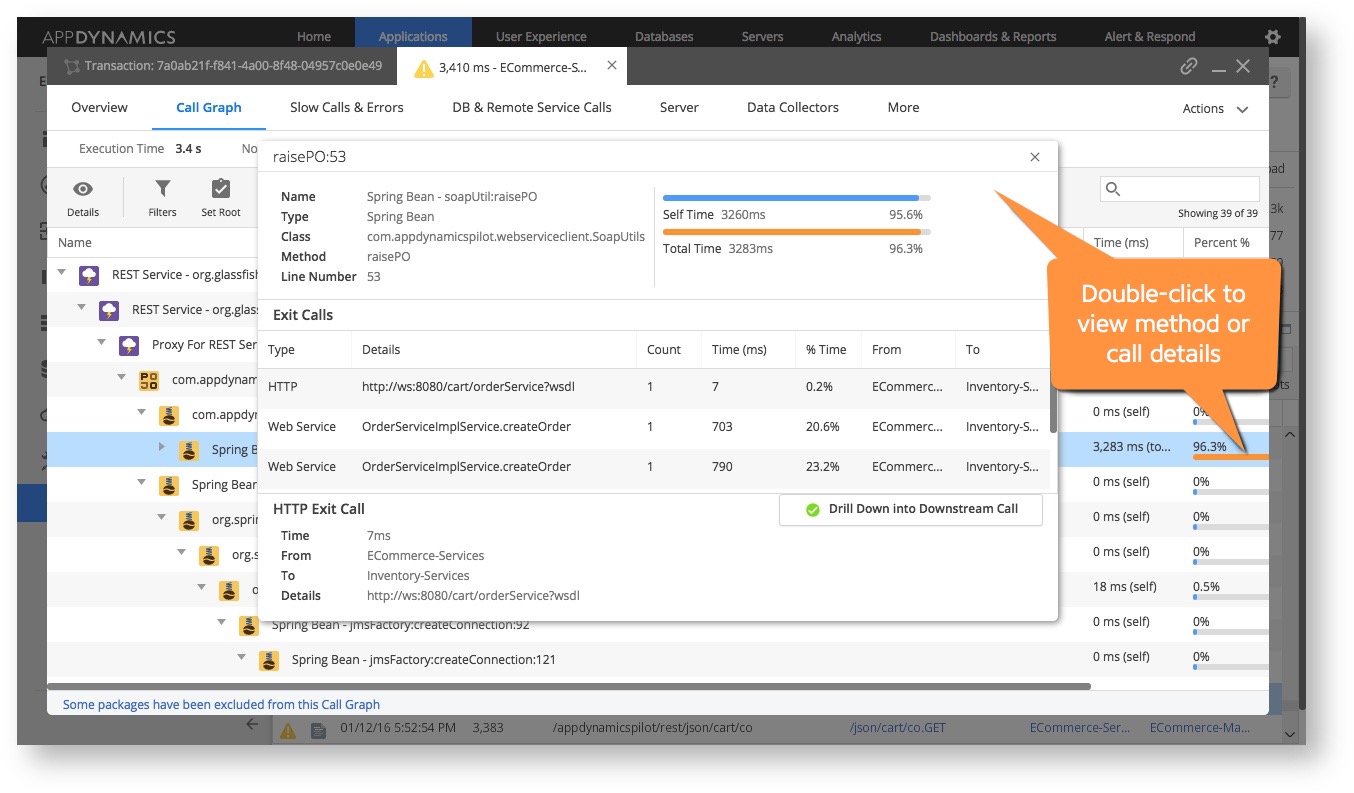
- Note the Class, Method, and Line Number (if available) represented by the execution segment. This information provides a starting point for troubleshooting this code issue.
If there are multiple slow or stalled transactions, repeat this step until you have resolved them all and then continue to Step 3.
Step 3: Check for slow database or remote service calls on the backend.
AppDynamics collects metrics about the performance of business transaction calls to the databases and remote servers from the instrumented app servers. You can drill down to the root cause of slow database and remote service calls.
- Click Troubleshoot > Slow Response Times, then click the Slowest DB & Remote Service Calls tab.
- Select a call from the list and click the View Snapshots link to show a list of Correlated Snapshots.

- Click the Exe Time (ms)column to sort the transactions from slowest to fastest.
- Select a transaction and click Drill Down.
- Select a potential issue from the Potential Issues list
- Click Drill Down into Call Graph to go directly to that point in the call graph, or click Drill Down in the flow map pane to see the complete set of call graph segments retained for this transaction.
- Review the Time (ms) column and select the transaction with the longest execution time for this method relative to the transaction execution time.
- Select the DB & Remote Service Calls tab.
- Do you see one or more slow calls on the SQL Calls or Remote Service Calls tabs?
Step 4: Drill into SQL or Remote Service Calls to determine the root cause.
- On the SQL Calls tab of the transaction snapshot, sort the SQL Calls by Avg. Time (ms).
- Slow database call– click the database call to gain information about the call.
- If you have Correlated snapshots between Java applications and Oracle databases – drill down into the Oracle database on the Transaction Snapshot to view database details captured during the snapshot.
If you have AppDynamics for Databases – right-click the database on the Application, Tier, Node or Backend Flow Map, and choose Link to AppDynamics for Databases. You can use AppDynamics for Databases to diagnose database issues.
- If you have Database Monitoring – right-click the database on the Application, Tier, Node or Backend Flow Map, and choose View to review database problems.


- On the Remote Service Calls tab, sort the queries by Avg. Time (ms).
- Select the slow call.
- Click Drill Down into Downstream Call to gain further insight into the methods of the service call.
- Sort the methods by the Time (ms) column.
- Select a slow method.
Click Details
.
Step 5: Does the problem affect all nodes in the slow tier.
- In the Application or Tier Flow Map, click the tier or node icon to see a quick overview of the health of each node in the tier.

- Is the problem affecting all nodes in the slow tier? If all the nodes are yellow or red, the answer to this question is Yes. Otherwise, the answer is No.
- If Yes – Go to Step 6.
- If No – The problem is either in the node's hardware or in the way the software is configured on the node. If only one node in a tier is affected, the problem is probably not related to the application code. Follow these steps to determine a hardware related problem.
- In the left navigation pane, click Tiers & Nodes.
- Expand the Tier in the right pane and double-click the affected node to open its Node Dashboard.
- Click the Memory tab
- Explore each of the available tabs to determine if you need to add memory to the node, configure additional memory for the application, or take some other corrective action.
- Click the Server tab.
- If the Hardware tab indicates a hardware related problem, contact your IT department.
- If the Hardware tab indicates a hardware related problem, contact your IT department.
You have isolated the problem.
Step 6: Check to see whether the problem affects most business transactions
- On the Application Dashboard, look at the Business Transaction Health pane on the right side of the screen.

- Is the bar representing Business Transaction Health is primarily yellow or red? Yes or No?
- If No – Then:
- Click Business Transactions in the left navigation pane.
- Sort by Health, Transaction Score or other column headings to find the business transaction that is experiencing issues.
- Double-click the problematic business transaction to see its dashboard, then use the tabs to diagnose the problem.
You have isolated the problem.
Additional Help
If you've tried to diagnose the problem using the previous steps and haven't found the problem, see additional information for your specific agent: