Download PDF
Download page Troubleshoot Health Rule Violations.
Troubleshoot Health Rule Violations
A health rule is violated when the health rule processor detects that the health rule's critical or warning condition is true. In this case, a health rule violation is created with a status of Open, and a Health Rule Violation Started - Critical event or a Health Rule Violation Started - Warning event is generated.
A health rule violation ends when it is either: resolved (the agent reports metrics that indicate that that the violated condition is no longer true) or canceled (the health rule processor can no longer accurately assert that the health rule violation continues to violate or that it has ended).
When the violation status of a health rule becomes resolved, a Health Rule Violation Canceled - Critical event or a Health Rule Violation Ended - Warning event is generated.
The health rule violation status is canceled when:
- The health rule is edited
- The health rule is disabled
- Affected entities or evaluation entities on which the health rule is based are added or removed
- The metric values on which the health rule violation is based become
UNKNOWN The health rule continues to violate straight for 72 hours

When a health rule continues to violate for more than 72 hours, it means that you may have configured the health rule to be too sensitive and you may not have initiated any remediation action. Hence, the current violation is cancelled and the evaluation is restarted.
When the violation status of a health rule becomes Canceled, a Health Rule Violation Ended - Canceled event or a Health Rule Violation Canceled - Warning event is generated.
If the same health rule is violated after a violation of it has been resolved or canceled, a new health rule violation is started.
During the life of a single health rule violation, there may be other types of health rule violation events such as Health Rule Violation Ungraded/Downgraded/Continues events.
The figure below illustrates the health rule violation life cycle.

The boxes represent the health rules violation statuses that you see in the health rule violations list in Troubleshoot > Health Rule Violations. To get more information about a particular violation, select the violation in the list and click Details. You can also view the health rule violations in the Controller UI.

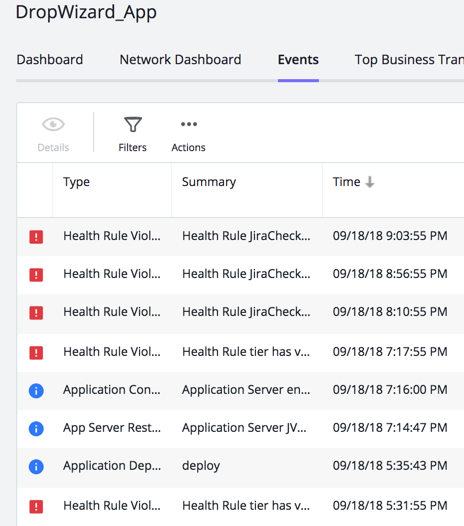
Health rule violation events are listed in the Events tab of various dashboards.
Because there is a set of default health rules, you may see health rule violations reported for your application even if you have not set up your own health rules. Violations reported for the APPDYNAMICS_DEFAULT_TX business transaction are for default health rule violations in the All Other Traffic business transaction.
Find Heath Rule Violations
To find all health rule violations:
In the left navigation pane, click Troubleshoot > Health Rule Violations.
The list of health rule violations displays.
You can also access this screen directly from the left navigation pane of an EUM application.
- Select All Health Rule Violations in the Time Range or Only Health Rule Violations Open Now from the drop-down list.
It is possible that health rule violations that were reported are no longer open because remedial action has been taken or performance has improved on its own. - You can filter the list. To see the filters, click Filters. To hide them, click Filters again.
With the filters showing in the left filters panel, you can select the health rule violations that you want to troubleshoot.
You can view all health rule violations or expand the nodes in the tree to select by health rule type or affected entity, such as business transaction, tier or node.
You can filter health rule violations by entering the name of the health rule in the search field on the upper right.
The health rule violations are displayed in the right panel, with their affected entity, status, description, start time, end time and duration, if ended.
Examine a Health Rule Violation
To view details about a particular health rule violation:
- Select the health rule violation row in the list.
- Click View Health Rule Violation Details.
In the Health Rule Violation summary window, you can click the Affects link to see the dashboard of the entity affected by the health rule. Alternately, click the View Dashboard During Health Rule Violation button to view the dashboard at the time the violation occurred.
The hyperlink to access the affected entity dashboard is not displayed for a Server health rule with entity type Machine_Instance when a health rule violation occurs. Navigate to the Health Rule window, Affected Entities tab to view the list of affected entities.
You can also access details of a health rule violation from the health indicators in the UI. For example, if you see the red indicator on the dashboard indicating that Business Transaction Health or Server Health is critical, click it to get the list of business transactions or tiers and then click the icon in the Health column of the list.
View Actions Triggered by a Health Rule Violation
For health rules that trigger actions configured by policies, you can get information about the action that was executed.
To view the action triggered by a health rule violation:
- In the dashboard of the entity affected by the health rule violation, click the Events tab.
- In the events list, locate the health rule violation that you are interested in examining. If an action was triggered by the health rule violation event, you will see an event icon in the Actions column of the list.
- Select the row for the event.
- Click Details.
- In the health rule violation window, click the Actions Executed tab.