Download PDF
Download page Agent-to-Controller Connections.
Agent-to-Controller Connections
AppDynamics app agents need to connect to an AppDynamics Controller to retrieve configuration data and send back information about the monitored environment. This page provides information about the connections between the agents and Controller.
Connection Settings
The connection between the agent and Controller is a one-way connection initiated by the agent. Therefore, you only need to configure connection settings in the agent.
To connect an agent to the Controller, you must provide this information:
- Controller host: The hostname of the Controller to connect to. Agents may connect directly to the Controller or through a proxy.
- Controller port: The port on which the Controller listens for agent traffic. Agents use port 443, which is the same port as the browser connection to the Controller UI.
- Account name: The name of the account listed in the Controller. A single tenant Controller has two accounts, a default account name, customer1, and an internal system account. For most connections, use the default account name.
- Global Account name: The Global Account name is used for certain connections, such as to the Events Service or from the Analytics Agent.
- Account access key: A unique key associated with the Controller account. See Find Your Account and Access Key.
- SSL enabled: If the agent should connect using SSL.
If you downloaded the agent through the Getting Started Wizard in the Controller, the Controller host, port, and account settings are already configured.
To connect the agents in your environment to a SaaS Controller or an on-premises Controller through a proxy, configure the agent properties to use the host and port settings of the Controller. For an example, see Java Agent Configuration Properties for proxy settings descriptions.
To connect to SaaS Controllers from agents in environments that limit outbound connections, set firewall rules that permit access to AppDynamics SaaS platform components. For a list of SaaS IP addresses, see Cisco AppDynamics SaaS Domains and IP Ranges.
Find Your Account Name and Access Key
To configure the agent manually rather than through the Agent Download Wizard, set the Controller host and port, account name, and account access key settings manually. If you have an Admin account, you can find your account name and access key in the AppDynamics Controller UI. If you are not an admin, ask your administrator for your access key.
To view your account name and default access key:
- Log in to the Controller UI as a user with view license permissions.
- Click the gear icon
 and select License.
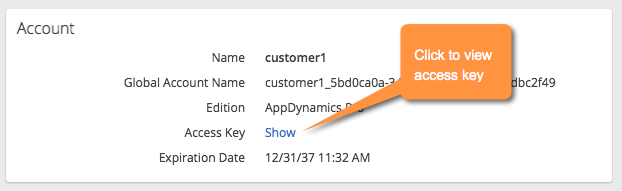
 - Click on the Account tab. The account name appears next to the Name label. The account name is customer1 in a single tenant, on-premises Controller; the account name varies on SaaS Controllers.
- Click Show next to the Access Key label to reveal the account default access key setting for this instance. Use this value as the Account access key setting in agent settings.
If you create license rules in addition to the default rule, the access key for each rule appears in the Rules tab.
Secure the Connection
The .NET Agent uses the settings in the container to negotiate the SSL protocol with the Controller. Normally you do not need to configure the security protocol for the .NET Agent.
For the Java Agent, see the Agent and Controller Compatibility for a list of the default security protocols for different versions of the Java Agent.
If the default security protocol for your version of the Java Agent is incompatible with the Controller or an intervening proxy, pass the ‑Dappdynamics.agent.ssl.protocol system property to set the protocol to one of these security protocols:
- SSL
- TLS
- TLSv1.2
- TLSv1.1
Use the following format:
java -javaagent:<agent_home>/javaagent.jar ... -Dappdynamics.agent.ssl.protocol <protocol> ...
Controller-specific security considerations vary between SaaS and on-premises Controllers, as described below.
On-premises Controller Secure Connections
An on-premises Controller has both an active secure (HTTPS) port and an HTTP port. Agents can use either port to connect to the Controller. By default, the certificate used for the secure connection is a self-signed certificate. The .NET Agents cannot connect on a secure port that uses a self-signed certificate, so you must apply your own certificate to the secure port. App Agents connecting to an AppDynamics SaaS Controller must use an HTTPS connection.
To implement SSL for the Controller-agent connection:
- Set the application server primary port to the SSL port, 8181 by default. See Port Settings.
- Install a trusted certificate. See Controller SSL and Certificates.
- Configure your agents for SSL. See App Agent Security and Machine Agent Security.
SaaS Controller Secure Connections
SaaS Controllers require the use of SSL. Therefore, you only need to enable SSL in the configuration settings for your agents and connect them to the secure Controller port, 443. See App Agent Security and Machine Agent Security.
App Agent Security
To configure your agents for SSL, set these SSL-related properties:
- Set
controller-ssl-enabledtotrue. - Set the
controller-portto the correct value for either on-premises or SaaS Controller.
In multi-tenant and SaaS environments, App Agents authenticate themselves to the Controller using the required account name and account access key values set in the connection properties configuration file.
Machine Agent Security
For information on the security settings related to the Machine Agent connection to the Controller, see Machine Agent Configuration Properties.
Verify the Connection
You can verify that an app agent is reporting to the Controller from the Tiers & Nodes list in the Controller UI. See Tiers and Nodes. You can also verify the connection from the AppDynamics Agents page, under the gear icon, see Manage App Agents.
In the Tiers & Nodes pages, the App Agent Status column indicates the status of the agent connection to the Controller. A green arrow icon indicates active connected agents, a red down arrow indicates an agent that has been previously recognized but is not currently connected.
If the agent is not reporting to the Controller, see troubleshooting information:
- Troubleshooting Java Agent Issues
- Troubleshoot .NET Agent Issues
- Dynamic Language Agent Proxy
- Resolve PHP Agent Installation Issues
If traffic is not being properly correlated between tiers, make sure that any network components, such as load balancers or routers that sit between monitored nodes, are preserving the AppDynamics correlation header from HTTP traffic.
Agent-Controller Communication Intervals
Each AppDynamics agent has multiple communication channels for different purposes that initiate connections to the Controller independently, and at different time intervals.
- The agent configuration channel queries the Controller for any new configuration changes, and downloads these changes when available, every 60 seconds.
- The agent metric channel posts all new periodic metrics, including JMX, Windows performance counters, and business transaction metrics to the Controller every 60 seconds.
- If there are new business transactions that have not been seen before by the agent, they are posted to the Controller for registration every 10 seconds.
- If the agent has collected any new snapshots or events, they are posted to the Controller every 20 seconds.
Information Sent to the Controller
This table shows the types of information that is collected by an application agent and sent to the Controller.
| Metric | Description |
|---|---|
| Server Request GUID | A unique GUID identifying a request, known as a Business Transaction, in the form of xxxxxxxx-xxxx-xxxx- xxxx-xxxxxxxxxxxx where x is a lower-case hexadecimal digit. |
| Application Entry Points | Transaction entry points are identified among various frameworks and technologies. This includes Servlet URIs, Strut Action and Method name, Spring Bean Name and Method Name, JMS queue destination or listener name, Web Service/WCF action/operation name, PHP Virtual Name, and more. |
| Application Exit Points | Transaction exit points are identified among various frameworks and technologies. This includes: HTTP URL end points, JMS queue/destination, type, and vendor; database URL endpoint and vendor/version, web service Service Name, cache name and URL endpoint. |
| Performance Metrics | In general, for each monitored metric in AppDynamics, a response time, call rate, and error rate are collected. Each of these metrics also have an automatic baseline derived for each respective metric value. |
| Thread Stack Traces | Code level method execution metrics that comprise the application request are collected. This data includes the class and method that executed and the line number within the source code. Note that less than 5% of transactions will have stack traces collected. Errors/Exceptions and stack trace of error data will be collected. |
| SQL Query Values | If assigned with administrative permissions, SQL query variables within a query can be enabled, collected, and viewed. Note that the parameter data is collected for less than 5% of transactions. Configuration changes are logged in an audit log that is available for security review. |
| Data Collectors | If assigned with administrative permissions, data in the form of HTTP values or method payload can be collected and viewed. Note that a specific data collectors and code payload accessors require explicit configuration to be collected. Note, data is collected for less than 5% of transactions. Configuration changes are logged in an audit log that is available for security review. |
| Hostname | The DNS hostname of the machine (virtual/physical) from where the agent is installed and reporting monitoring data. |
| IP Address Internet Protocol (IP) | IP Address Internet Protocol (IP) address of the machine (virtual/physical) where the agent is sending monitoring data from. |
| CPU Usage | The value of CPU that is consumed on the monitored machine/virtual machine. |
| Memory Usage | The value of physical memory that is consumed on the monitored/virtual machine. |
| Network I/O Usage | The value of network I/O that is consumed on the monitored machine/virtual machine. |
| Disk I/O Usage | The value of disk I/O that is consumed on the monitored machine/virtual machine. |
| JVM Performance | JVM Heap Usage, JVM Memory Pools Settings, Garbage Collection performance, JVM System/Start-up Options, MBean metric values (for example, connection pool names and metric values, such as active connections, maximum connections, and so on) |
Blitz Load Profile
Blitz is a horizontally scalable data processing platform for SaaS deployments. It collects metric data from agents, which it then aggregates and stores.
The 10M metrics/min Blitz load profile includes the following agents and churn information:
Active load 10MM with 24K nodes. Total registered metrics is 40M.
Node distribution:
DotNet = 3K
- SIM Machine Agents OR Docker Containers = 30K
DBMon Data Collectors = 1K
Java Nodes = 16K
EUM Browser Apps = 60
Java Node Churn: 1K/hr
Either SIM or Docker Churn
Sim Node Churn = 40/hr (1% of 4K SIM nodes)
Docker Churn = 200 containers/hr
Node purger enabled with hard-limit of 4K and soft-limit of 10K
SIM node purger enabled with a deletion max limit of 300/hr