Mobile RUM collects data on every network request that you have instrumented, and it also takes detailed snapshots periodically in case performance issues have been detected.
Based on network request performance data, Mobile RUM calculates metrics which are associated with each network request and with predefined aggregations across network requests. You can focus on certain aspects of the performance data using more specific or flexible criteria, such as all network requests from a specific country and originating from a specific carrier.
With Analyze, every single network request event is collected and stored by the AppDynamics Events Service. Using Analyze, you can see results based on this cumulative data in tabular form or as charts.
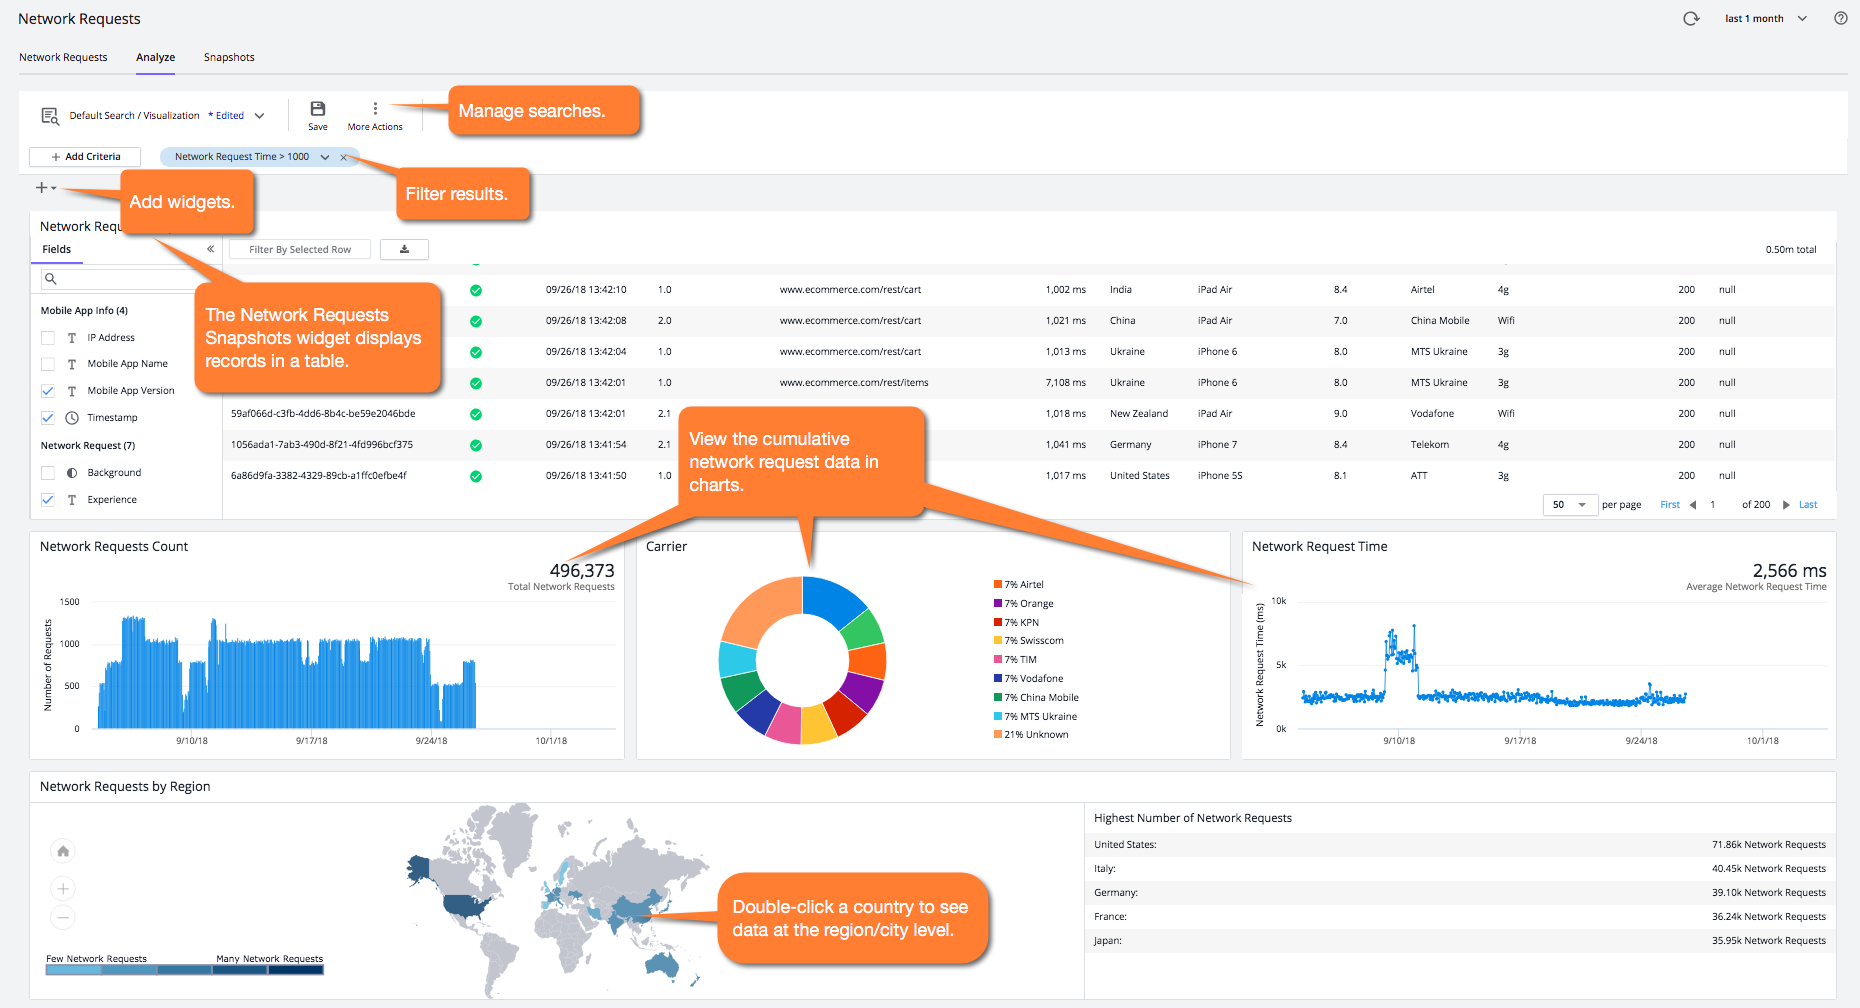
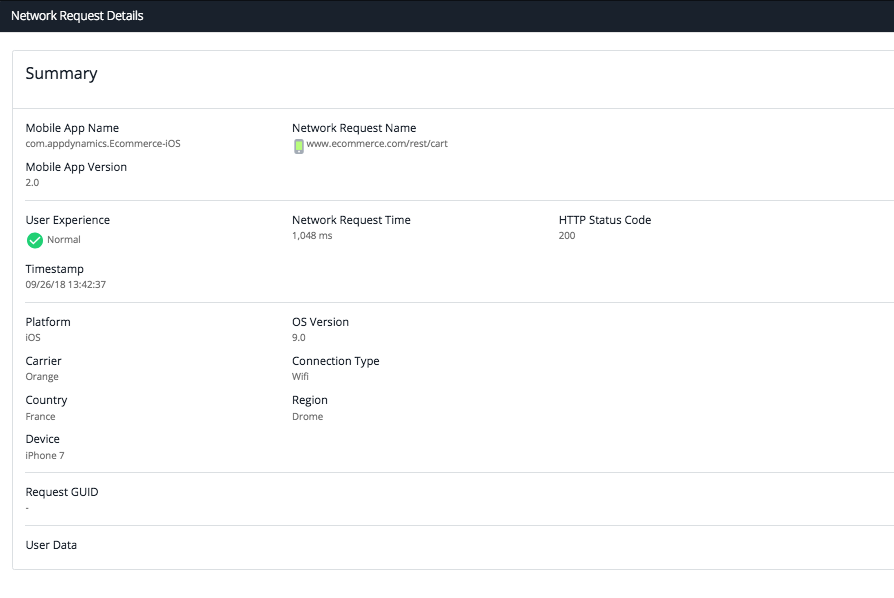
Double-click a network request snapshot in the Network Request Snapshots widget to see the information for a specific request.
Mobile RUM Network Request Analyze Versus Mobile Requests Analytics
The data shown in the Analyze page is processed and stored by the AppDynamics Platform Events Service. Network Request Analyze provides a number of widely used visualization types to let you explore your application's performance. A separate product, AppDynamics Mobile Analytics, has components called Mobile Requests and Mobile Crash Reports. These components are based on the same Events Service and use the same data, but offer additional capabilities, including:
- Additional predefined widgets, such as the funnel widget
- ADQL for searching the data
- Creating custom widgets
- Manipulating multiple dashboard types
- Longer retention time for storing data
AppDynamics Mobile Requests Analytics requires a license separate from the Mobile RUM license. See Analytics Mobile Requests Data.