This page describes how to view and monitor JVM crashes with JVM Crash Guard. When a JVM crash occurs, you need to know as soon as possible. A JVM crash may be a sign of a severe runtime problem in an application and often calls for immediate remediation steps.
When a JVM crash occurs, a corresponding event type is generated in the Controller UI.
To analyze and troubleshoot the crash:
- In the Events panel, double-click the JVM Crash of interest.
- Examine any logs associated with the JVM Crash event. (The local log folder is determined by the type of JVM and how it is configured. For more information, refer to the documentation for the specific JVM.)
The JVM Crash panel also displays information about actions executed as a result of the crash. These are actions that you specify when creating a policy that is triggered by a JVM crash event. See Policies.
The JVM Crash event details include this information:
- Timestamp
- Crash reason
- Hostname IP address
- Process ID
- Application name
- Node name
- Tier name
In the JVM Crash Details tab, the Crash Reason details field (if available) indicates the root cause of the crash. For example, the field could contain java.lang.OutOfMemoryError or Segmentation Fault.
To facilitate the discovery and display of the reason for the JVM crash, JVM Crash Guard supports:
- Hotspot JVM error log analysis
- IBM JVM system dump log analysis
- Jrockit JVM error log analysis
Enable Monitoring for JVM Crashes
Before you can monitor JVM crashes, you must:
- Install and enable a Machine Agent on the machine you want to monitor for JVM crashes. JVM Crash Guard works with the Machine Agent to trigger a policy when a JVM Crash event occurs.
- Ensure that the Machine Agent is running with the required privileges:
- On Windows, the Machine Agent must run in Administrator root mode.
- On Linux, JVM Crash Guard requires that the Machine Agent user be able to read all the processes in
/proc/*. This may be the root user or another user with this privilege.
- Enable the JVM Crash Guard (it is disabled by default). Navigate to
extensions/CrashGuard/conf/crashGuardConfig.yml and open the crashGuardConfig.yml file. Set enabled to true.
Once you have verified the requirements, follow these steps to create a policy for JVM crash events:
From the left-hand navigation menu, click Alert & Respond > Policies > Create a Policy.
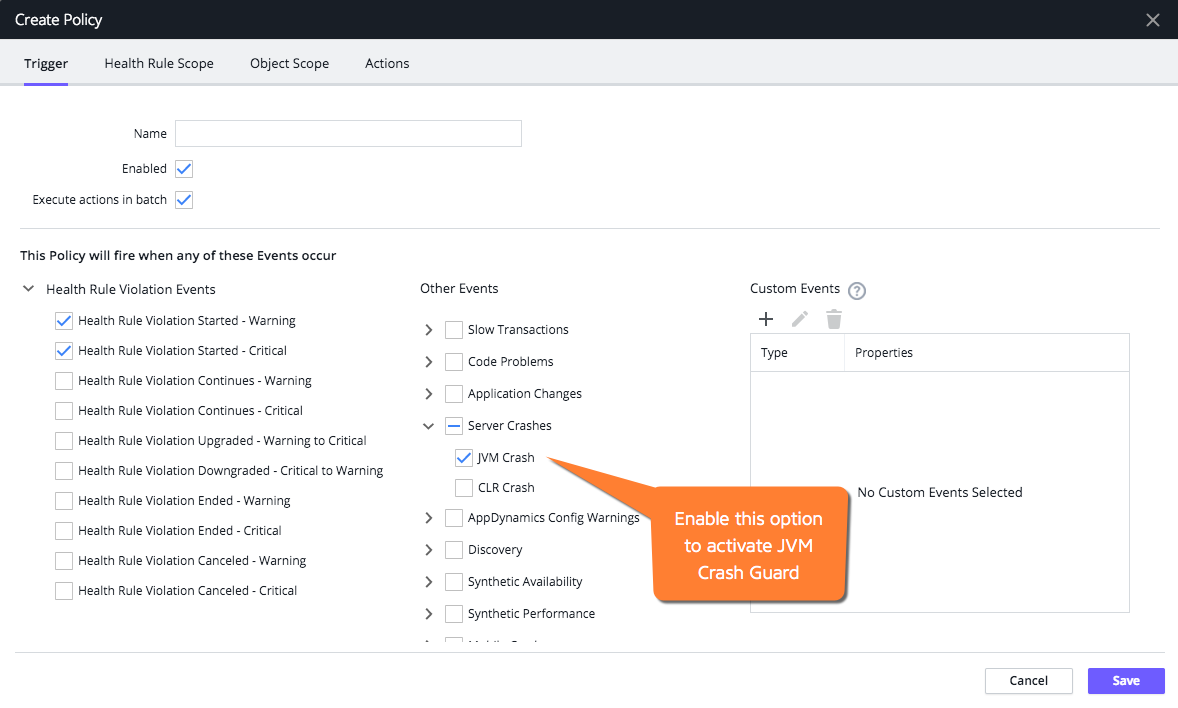
- In the Other Events section, expand the Server Crashes option and click JVM Crash. The JVM Crash event then becomes a trigger to fire a policy.
- Proceed as usual to create the policy. See Policies.
If an uninstrumented JVM crash occurs within less than a minute of a previous crash, it will not be reported by the Machine Agent. In some circumstances, the JVM may crash and then be restarted only to crash again within one minute. For this repetitive cycle crash and restart scenario, only the first JVM crash is reported by the agent.