Download PDF
Download page Troubleshoot Analytics Issues.
Troubleshoot Analytics Issues
This page provides general troubleshooting techniques for deployment issues and workarounds for certain scenarios in Application Analytics.
General Troubleshooting Issues
If you encounter problems with your Analytics deployment, check the logs for errors and warnings.
These logs are useful to:
- Determine if the Analytics Dynamic Service is enabled or disabled.
- Determine if the Analytics Dynamic Service encounters errors sending messages to the Analytics Agent. For example, when the Analytics Dynamic Service is not able to communicate with the Analytics Agent due to invalid connection configuration.
- Determine if messages are being dropped by the Analytics Dynamic Service because its internal buffers are full.
- View the configurations used on startup.
The following components write log information.
- Analytics Agent: The Analytics Agent writes log messages to files in the
<analytics_agent_home>/logsdirectory. - Events Service: The Events Service writes log messages to files in the
<events_service_home>/logsdirectory. Theevents-service-api-store.logfile can help with troubleshooting. - Java Agent: The Analytics Dynamic Service is built into the Java Agent and writes logs to the same file as the app agent. The logs are in the
<application_home>/<app_agent_home>/logsdirectory.- The primary log file to use for troubleshooting is the file named
agent.<timestamp>.log. Search the file for messages written by the Analytics Dynamic Service.
- The primary log file to use for troubleshooting is the file named
- .NET Agent: The .NET Agent writes log messages to files in the
%ProgramData%\AppDynamics\DotNetAgent\Logsdirectory. By default, the .NET Agent writes Analytics logs from thecom.appdynamics.ee.service.analytics.Analyticslogger to determine if the Analytics Dynamic Service is enabled/disabled and to view the configuration on startup. Errors are logged in thewarnfile.- The
com.appdynamics.CONFIG.AnalyticsDynamicServiceConfigListenerlogger gathers Analytics Dynamic Service configuration details from the Controller. Ensure that theeventServiceURLcomes from the Controller. - The
com.appdynamics.analytics.EventsServiceSinklogger provides information about the communication between the .NET Agent and the Events Service.
- The
Configuration Issues
Verify that your configuration settings are properly configured with the required account name and key. Slashes in account names and key values must be escaped.
Windows Commands
On Windows, you cannot delete a log file with the del command when the Analytics Agent is collecting log data from the file.
Do not use robocopy commands to move files on Windows. AppDynamics recommends that you use the move command instead.
Starting the Analytics Agent Issues
If you are running the Analytics Agent as an extension to the Machine Agent with JRE 1.8.0_171 or later, starting the Analytics Agent with encrypted credentials will fail. Workarounds include:
- Disable encryption in the Machine Agent
- Use a standalone Analytics Agent with encryption
- Use JRE 1.8.0_162 to run the Machine Agent with encryption
PID File
If an instance of the Analytics Agent terminates and leaves behind a process ID file (PID file), the next agent startup will fail with the following error:
java.lang.RuntimeException: Unable to create file [D:\AppDynamics\analytics-agent\analytics-agent.id] to store the process id because it already exists. Please stop any currently running process and delete the process id fileYou can use the -f flag option while starting the agent. This option causes a pre-existing process id file to be deleted. The flag is not required when you are starting the agent as a Windows service.
Use the -f flag as follows:
- UNIX type OS:
start -f - Windows CLI:
start -f
The -f flag option only works for the standalone Analytics Agent. This option does not work for the Analytics Agent embedded in the Machine Agent. In versions 20.6 and later of the Machine Agent, the bundled Analytics Agent no longer drops a PID file.
For the Analytics Agent running inside the Machine Agent (embedded mode), upgrade the Machine Agent to 20.6. You no longer need to delete PID files from previous runs where the agent crashed.
High CPU Usage in Transaction Analytics without Analytics Agent (Agentless Analytics)
Reaching the Transaction Analytics license limit may cause high CPU usage in older Java Agents. AppDynamics recommends that you upgrade to the Java Agent version 20.3 and later. Look out for high CPU and memory usage in the .NET Agent.
Analytics Data Issues
Clock Management
AppDynamics recommends maintaining clock-time consistency throughout your monitored environment. If Analytics metrics are consistently reporting zero, confirm that clocks are synchronized across the application, Controller, and Events Service nodes.
Timestamps
There are potentially four time zones involved with Log Analytics:
- The timestamp and time zone from the log file.
- The event timestamp and pickup timestamp time zones can be different from those in the log for a number of reasons:
- When the time zone is overridden.
- The time zone is not provided correctly in the log.
- The timestamp and time zone parsing goes awry.
- When no time zone is specified in the log timestamp, then local time is assumed.
- The Events Service time zone and the Events Service stores all timestamps in UTC time.
- The browser used to view the Analytics data in the Controller UI (such as the Event Timestamp column in the UI search results or the Time Picker widget) converts all timestamps to the browser's local time.
Environment Variables
If you are not seeing or only seeing partial Analytics data in the Controller, configure the following environment variables.
| Environment Variable | Description |
|---|---|
appdynamics.analytics.agent.send.attempt.max | The maximum number of times that the Dynamic Service running in the APM Agent will try sending the Analytics data after a communication failure. |
appdynamics.analytics.agent.send.attempt.pauseMillis | The wait time between attempts to send Analytics data to the Analytics Agent after a communication failure. |
appdynamics.analytics.numOfSinkWriterTasks | The number of sinks used by the Dynamic Service running in APM Agent to send data to Analytics Agent. The default number is 2 and can be increased as needed. |
Log Analytics Missing Field Extractions Issues
If you are missing fields in your Log Analytics data that you expect to see based on your source rule configuration or using regex (including grok patterns) in your field extraction, you may encounter a performance safeguard.
If a regex pattern takes more than five seconds to match against a log line, the attempt to extract the fields is terminated. No further processing that requires the extracted fields will occur. As a result, some fields may be missing when viewed on the Controller for that log line. In this case, the following error message appears in the Analytics Agent log:
[ERROR ] java.util.concurrent.TimeoutException: The current regex has spent 5 seconds attempting to match the log line, further processing has been stopped for this log line.Another reason for missing fields is if the log line doesn't contain the field to be extracted as defined in the pattern.
Custom Analytics Metrics Issues
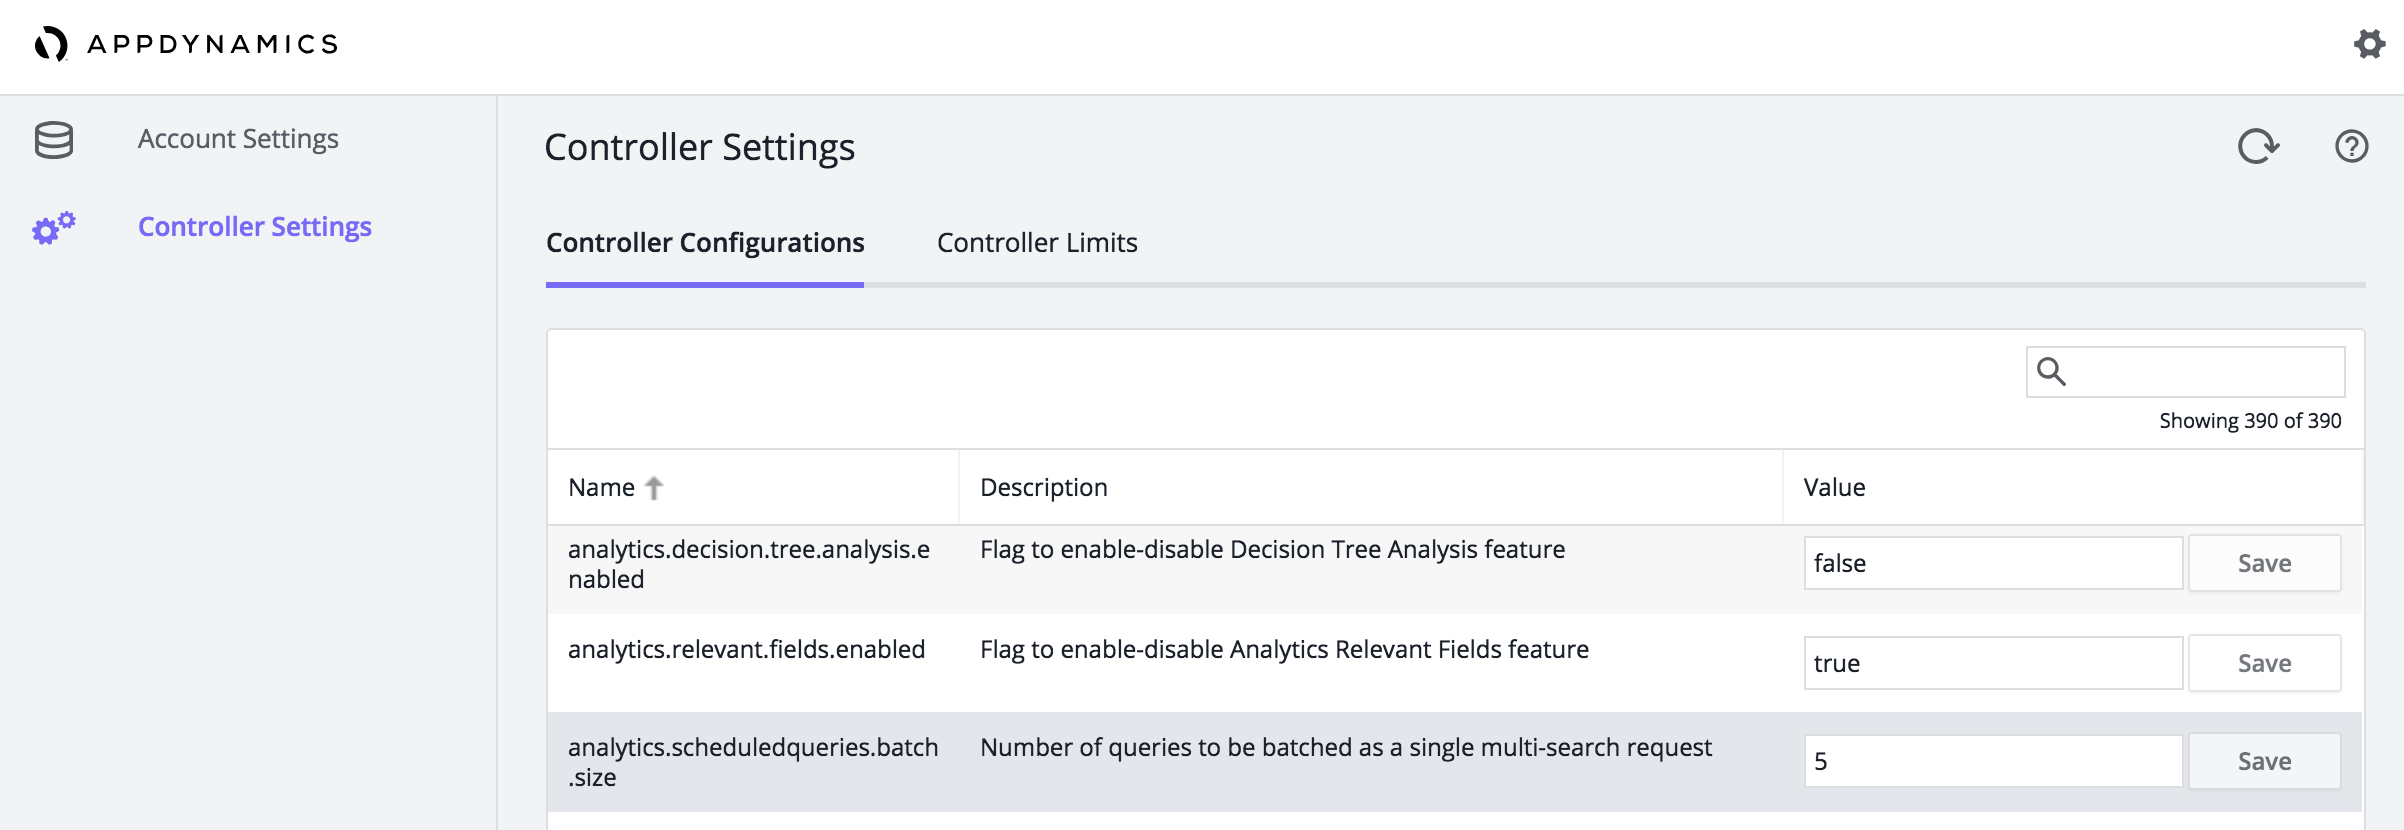
If you are having issues with metrics created from saved searches or with the alerts performance for those metrics, try increasing the query batch size. You can increase the size using the analytics.scheduledqueries.batch.size Controller setting in Controller Settings > Controller Configurations. The default value for this setting is 5.
See Access the Administration Console for information about accessing the setting.
Business Transaction Events Limits
The Analytics Dynamic Service sends messages to the Events Service where the request body is an array of event segments. A business transaction event consists of one or more segments that are related to each other by the business transaction requestGUID. There are ingestion limits related to messages.
Event (segment) size: The maximum size of an individual business transaction segment collected by the Analytics Dynamic Service is .1 MB. This limit is defined by the
appdynamics.analytics.message.maxSizeBytesJava system property. To change this value, pass it on the command line as a system property when the Java Agent starts. For example:'-Dappdynamics.analytics.message.maxSizeBytes=1024000'CODEEvents per request: The maximum number of segments per request is defined by the
appdynamics.analytics.agent.send.batch.items.maxJava system property. The default value of this property is 16. To change this value, pass it on the command line as a system property when the Java Agent is started.- Message Size: This limit refers to the size of a single request body sent to the Events Service, which is usually an array of event segments. Publish requests for all event types are limited to 1 MB. If the limit is exceeded, you will see exceptions in agent log file and messages in Events Service logs.
Agent-Side Metrics
Analytics components in the Java Agent reports performance metrics. These metrics can be used to monitor the health of Transaction Analytics reporting in the agent/node. These metrics are under the Agent|Analytics|<Metric Name> path in the Metric Browser.
| Metric Name | Metric Time Rollup Type | Metric Cluster Rollup Type | Metric Description |
|---|---|---|---|
| Collector Objects Count | Current | Individual | The current count of Analytics data collectors in use. |
| Messages Sent | Sum | Collective | The number of messages sent. |
| Messages Dropped Since Input Queue Full | Sum | Collective | The number of dropped messages due to the input queue being full. |
| Messages Dropped Since Size Exceeded | Sum | Collective | The number of dropped messages due to message size exceeding limit. |
| Message Send Errors | Sum | Collective | The number of transient and permanent errors in event registration or publish. |
Message Latency (ms) | Average | Individual | Latency calculated in milliseconds. |
| Pending Messages In Queue | Current | Individual | Messages pending in the buffer. |
| Sink Writers Count | Current | Individual | Number of active sink writer threads. |
Firewall Considerations
Transaction Analytics without an Analytics Agent requires a connection between the Java/.NET Agent and the Events Service. If you have a firewall that blocks requests from the Java/.NET Agent to the SaaS or on-premises Events Service, you need to open the firewall to avoid gaps in Analytics data. See Port Settings and Agent-to-Controller Connections.
For SaaS-based installations, configure the Analytics endpoint by modifying the http.event.endpoint setting in the \conf\analytics-agent.properties file (as described in Install Agent-Side Components). For example, http.event.endpoint=http://analytics.api.appdynamics.com:443.
If your firewall rules require you to use specific IP addresses, rather than hostnames, note the following information. If you are unable to see Transaction Analytics data collected as expected (even after configuring your firewall rules) and you see repetitive Connection Reset messages in the logs similar to the following, your firewall rules may not include the correct IP addresses.
[2015-12-18T16:08:39,907-06:00] [INFO ] [AD Thread Pool-Global0] [o.a.http.impl.execchain.RetryExec] I/O exception (java.net.SocketException) caught when processing request to {s}->https://analytics.api.appdynamics.com:443: Connection resetYour firewall rules may not include the correct IP addresses.
In SaaS environments, analytics.api.appdynamics.com, fra-ana-api.saas.appdynamics.com, and syd-ana-api.saas.appdynamics.com are round-robin DNS aliases and may resolve to multiple DNS (54. vs 52.) in the following examples.
CODE
|
CODE
|
CODE
|
Amazon Web Services (AWS) controls the IPs used, so they may change from time to time. AWS publishes its current IP address ranges in JSON format, so if you are unable to open firewalls to hostnames, you can download the AWS IP address ranges. If you want to be notified whenever there is a change to the AWS IP address ranges, you can subscribe to receive notifications using Amazon SNS.
See Analytics IP Ranges for the AWS regions for the SaaS Analytics environments. You can view the AWS IP Ranges for each listed region.