The AppDynamics Server Visibility module uses the Machine Agent to provide extended hardware metrics. Server Visibility includes additional windows in the Controller UI that enable you to quickly see underlying infrastructure issues impacting your application performance and rapidly troubleshoot hardware performance problems.
Requirements
Feature Comparison
| Feature | Server Visibility | Machine Agent |
|---|
| Supported Platforms | Linux, Windows, Solaris, AIX | Linux and Unix-like systems,
MacOS, Windows, AIX |
| Extensions and Custom Metrics | Yes | Yes |
| Monitor Docker container metrics from the Docker host | Yes | No |
| Tier Metric Correlator | Yes | No |
| Dynamic Monitoring Mode | Yes | No |
| JVM Crash Guard | Yes | Yes |
| Remediation Scripts | Yes | Yes |
| Graphical User Interface | Yes | Functionality is limited to viewing Machine Agent metrics in the Servers List |
Extended Hardware Metrics | Yes | No |
| Server metrics in transaction snapshots | Yes | No |
| Server KPIs in application flow map | Yes | No |
| Health rules for extended hardware metrics | Yes | No |
| Licensing | Server Visibility | Machine Agent |
Permissions
Server Visibility provides two predefined roles, and two related permissions:
Server Visibility Administrator
Server Visibility User
View Server Visibility permission
Configure Server Visibility permission - enables configuring Service Availability
See Server Visibility Permissions.
Server Visibility User Interface
The Servers list provides key performance metrics for all your servers on a single panel.
The Servers > Dashboard shows key performance metrics for the selected machine, including the top ten consumers of CPU and memory.
The Servers > Volumes panel displays performance metrics for disks, partitions, and volumes for the selected machine.
The Servers > Network panel shows network performance metrics for network interfaces on the selected machine.
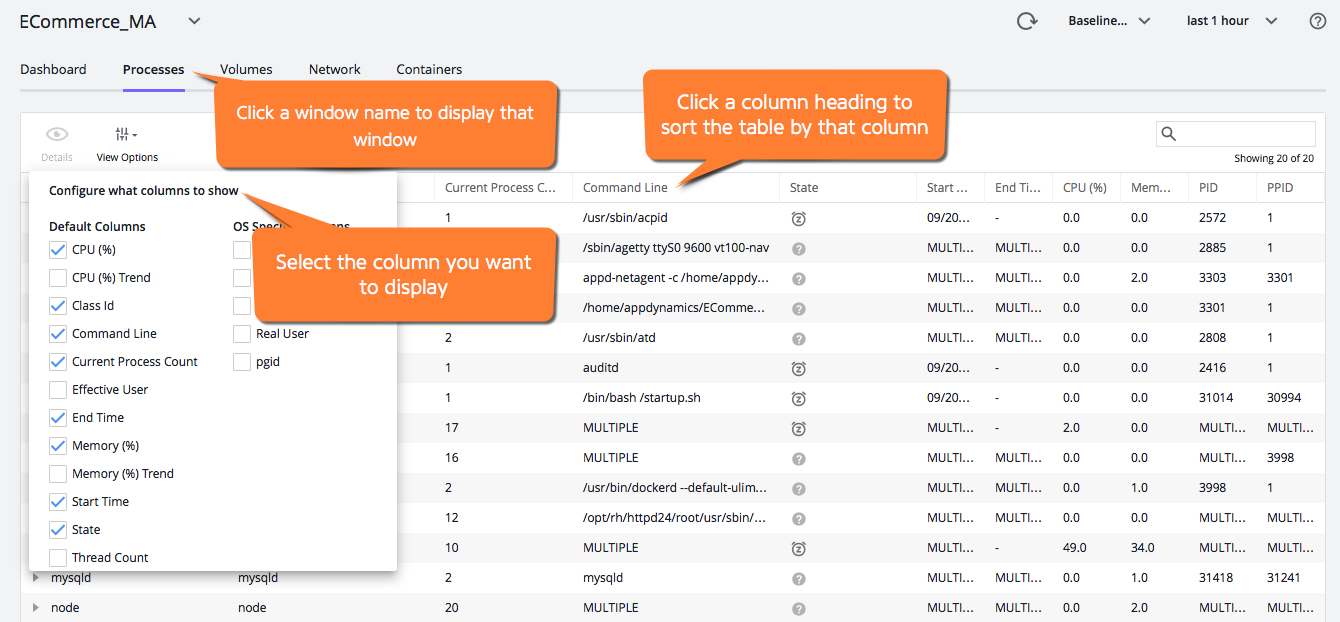
The Servers > Processes panel shows a configurable set of performance metrics for processes.
The Servers > Containers panel lists the monitored containers used by an application.
Using the Server Visibility UI
The Server Visibility user interface uses many of the same mechanisms that are common to the various panels of the Controller UI. The sample image illustrates these mechanisms.
Search Results and Sorting
Pagination is the default behavior on the Servers and Containers list pages. The information is retrieved on demand, and additional records are retrieved and displayed as you scroll. Search is only available for the Name and Host ID columns. Sorting is only available on the Hostname, Container, Metric %, and Health fields.