The Resource Performance Dashboard provides a high-level overview of how your resources affect the performance of your browser application. You can use this dashboard to pinpoint resource-related performance issues affecting the user experience, such as the following:
- A prioritized list of resource performance issues by comparing their performance against thresholds
- Changes in the number of resources
- Large resources (images, JavaScript, CSS, etc.)
- Size increase of resources impacting performance. For example, a page banner might be replaced with an uncompressed image, slowing down the page load.
- Slow CDNs
- Resources that haven't been compressed
- Comparison of real user and synthetic resource performance
Once you navigate to a browser application, the Resource Performance Dashboard is located on the left-side panel.

The Overview tab displays widgets providing high-level indicators of resource performance over a specified time period. The dashboard can be filtered to real user or synthetic data. The widgets only show a small number of resources, but you can click See More to view up to 100 resources per widget.

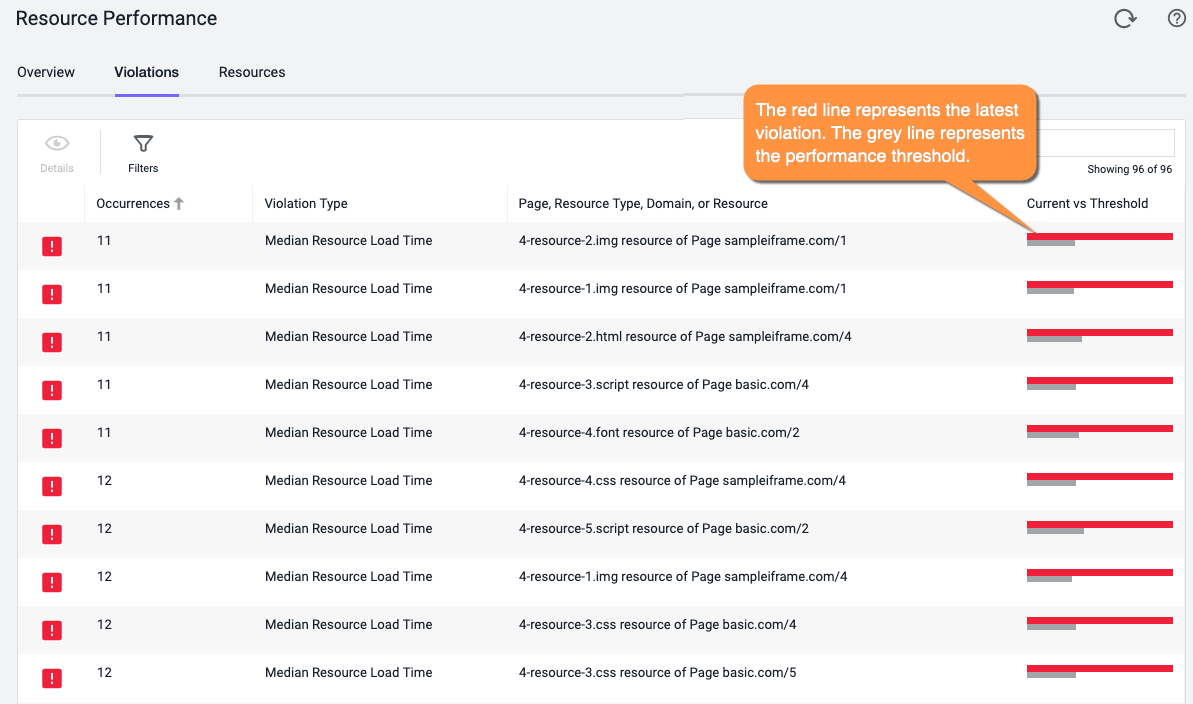
The Violations tab shows a list of pages, resource types, and domain or resource violations that have exceeded performance thresholds. You can use the Violations tab to not only find problematic resources, but also to become aware of sudden changes that negatively impacted the performance of a resource. Clicking a specific violation leads to the Resources tab, and the data is filtered with that violation for further diagnostics. The configured violation rules are evaluated every 10 minutes for the last 30 minutes.

The supported violation types include:
- Median Domain Load Time
- Average Domain Size
- Average Page Size
- Median Resource Load Time
- Average Resource Size
- Median Resource Type Load Time
- Average Resource Type Size
You can use the Resources tab to diagnose a problematic resource. You can also add criteria as a filter to the widgets. All use cases to troubleshoot a resource leads to the Resources tab where you can learn more about an individual resource's impact on an application. See Use Cases for examples.

For the Resource Performance Dashboard to be effective, it is highly recommended that you set the Timing-Allow-Origin HTTP header in all of your CORS domains to enable access to resource timing information. Without this header, the JavaScript Agent cannot capture the resource size, and, of the supported Resource Timing Metrics, only the resource load time can be calculated.
For information about resource performance data retention, see License Entitlements and Restrictions.