Download PDF
Download page Metric Browser.
Metric Browser
This page describes how the Metric Browser provides a metrics-oriented view of the monitored environment for a selected time period.
In the Metric Browser, you can see metrics by nodes, business transactions, the overall application, and more. You can also compare two or more metrics and view metrics relative to a baseline. Use this tool when you want to drill into and analyze the details for a specific metric.
- Click Metric Browser.
- Expand a metric group and double-click an option for that metric to display in the graph. Add multiple metrics in the same manner to compare them.
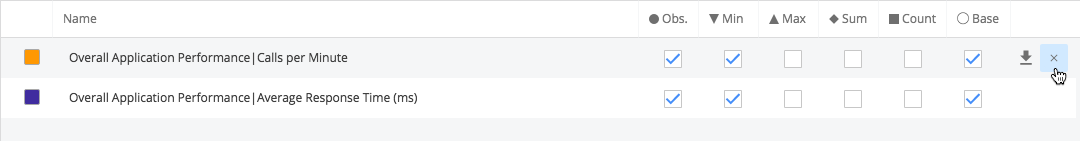
- Mark the checkbox for the type of data you want to see for each metric.
- Select Filters (
 ) and choose how you want to view data:
- Show Tiers / Nodes with performance data to show entities and metrics for live entities over the specified time range.
- Show Tiers / Nodes with no performance data to show metrics/entities of entities that are not alive over the specified time range.
- Select both checkboxes to show metrics and entities without checking the liveness of entities.
- Select Plot Points to enable the plot points on the graph line.
- Select a Scale option to adapt the scale of the y-axis unit according to the values in the graph.
To remove a single metric from the graph, click X or click Clear at the top of the metric browser to remove all metrics.
Metric Data Point Details
For most types of metrics in the browser, you can click any of the points in the graph to view more information about the metric observed at that point in time. The information shown includes the metric identifier, date and time of the observation and any of the following values relevant to the metric:
- Obs—The observed average of all data points seen for that interval. For the Percentile Metric for the App Agent for Java, this is the percentile value. For a cluster or a time rollup, this represents the weighted average across nodes or over time.
- Min—The minimum data point value for that interval.
- Max—The maximum data point value for that interval.
- Sum—The sum of all data point values for that interval. For the Percentile Metric for the App Agent for Java, this is the result of the percentile value multiplied by the Count.
- Count—The number of observations aggregated in that one point. For example, a count of five indicates that there were five one-minute data points aggregated into one point.
- Base—The baseline data for the metric. See Viewing Metrics Relative to Baselines.
By selecting the checkbox that corresponds to the metric information at the bottom of the graph, such as Min, Max, Count, or Sum, you can graph that information for the metric over the time range shown in the browser. Checkboxes for only the types of information relevant to the metric can be selected.
For node-level metrics only, min and max values are available for any count- or sum-based metrics and for when the metric is rolled up to hourly or daily data points. Min and max values are not visible for tier- and application-level metrics. Count- and sum-based metrics include errors per minute, calls per minute, and so on.
Analyze Performance for a Time Range
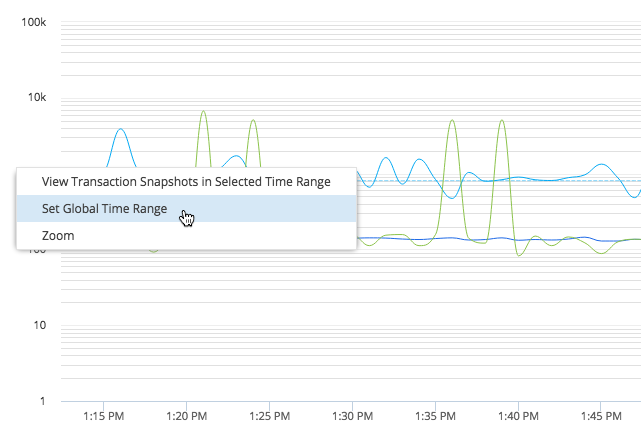
Once you identify a time frame of interest in the metric browser, you may want to see snapshots in that time range. To analyze snapshots during a time range in the browser, click and hold the start of the time range in the graph and drag to the end of the time range. Release to view the Time Range pane.
If you do not see a metric in the browser, you can add certain metrics by editing node properties. See App Agent Node Properties.
View Metrics Relative to Baselines
You can see how data in the Metric Browser compare to baseline values. Monitoring baseline deviation exposes performance metrics that might be violating your Service Level Agreements (SLAs). See Dynamic Baselines.
To display baseline patterns, select the baseline option for the metric in the view options for the metric.

Export Metric Data
You can export metric data that is currently displayed to a comma-separated values (CSV) file.
Exported data includes all the data displayed, even if there is a time range selected. To export data only for a specific time range, first set a global time range and then export.
To export all data:
- Select Actions > Export Data.
- In the popup, you can either copy the data to your clipboard or click Export Data to download the data as a CSV file.
To export data for an individual metric in the graph, click Download at the bottom of the graph.