Download PDF
Download page AppDynamics Concepts.
AppDynamics Concepts
This page describes the AppDynamics Application Performance Management (APM) Platform.
AppDynamics APM Platform Overview
The AppDynamics APM Platform enables management and monitoring of your application delivery ecosystem, ranging from mobile/browser client network requests to backend databases/servers and more. This global view across your application landscape allows you to quickly navigate through the distributed application into the call graphs and exception reports generated on individual hosts.
User Interface
Appdynamics provides a Tenant to collect, store, analyze, and baseline the performance data collected by agents and a UI to view and manage the information. You access the AppDynamics Tenant UI through a URL that uses your Account name. Each Tenant has a distinct set of users, reporting agents, and application monitoring configuration.
AppDynamics can host one or more accounts, where each account represents one Tenant. AppDynamics cloud-based Software as a Service (SaaS) deployment is a multi-tenant environment that allows you to access multiple Tenants independently.
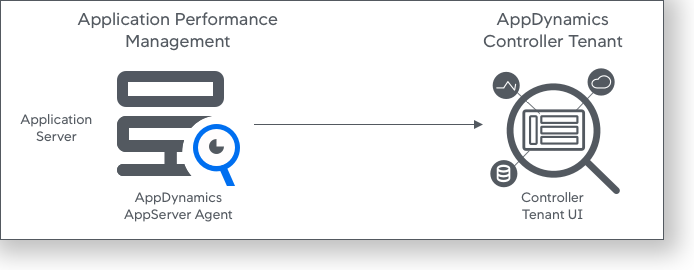
Application Performance Monitoring
At the tier level, AppDynamics provides a view of the runtime operation of your code via an AppDynamics App Server Agent. The agent detects calls to a service entry point at the tier and follows the execution path for the call through the call stack. It sends data about usage metrics, code exceptions, exit calls to backend systems, and error conditions to your Tenant.
To get started with application monitoring, see Install App Server Agents.
Most application environments contain more than one application server. They may contain distributed, interconnected servers and processes that participate in fulfilling a given user request. In this context, AppDynamics tracks transactions across distributed, heterogeneous services.
Infrastructure Visibility with Database Visibility
For greater visibility into your application delivery environment, you can add AppDynamics Database Visibility to the deployment.
App Agents provide information about calls to backend databases, including errors and call counts. The Database Visibility module extends your visibility into the workings of the database server itself by providing you with information about query execution and performance with an agent-less profile.
AppDynamics Infrastructure Visibility contributes to your view of the data center by adding valuable information on the performance of the machines and networks in your environment.
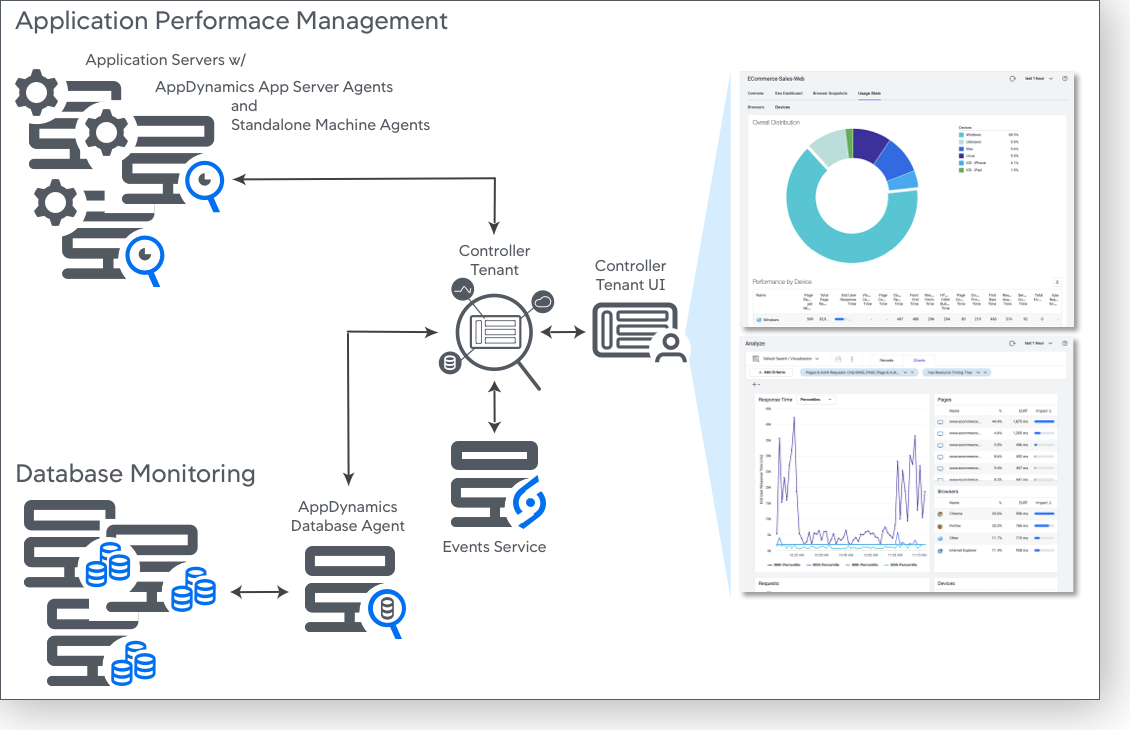
In this deployment, the Database Agent collects information from the database servers and sends it to the Tenant, which persists some of that information in the Events Service. Database Analytics features may use the Events Service, the document storage component of the platform that AppDynamics has optimized for searching and storing high volumes of information.
End User Monitoring for Client Experience
While server-side monitoring provides insight into the end user's experience with application performance and suggests performance improvements to the server, end-user monitoring extends those insights from the initial client request to the client device response. AppDynamics End User Monitoring allows you to collect the information about where your requests are coming from, what devices/channels your users are using, and your code performance once deployed on your users' devices. Additionally, AppDynamics provides you with the visibility you need to investigate mobile crashes by displaying stack traces and other contextual data at the time of the crash and tying that to the Business Transaction data from the server.
Business iQ and Analytics for Business Impact
How does the overall performance of your application environment affect your business? Business iQ, powered by AppDynamics Analytics, helps you understand how the performance of your application environment and end-user applications ties to the business data of the transactions. It lets you sort, order, and understand the data that composes the Business Transactions. It also enables you to drill into the varieties of log data that your environment generates. See Using Analytics Data for information about how to install and use Analytics.
Use Metrics
A metric is a particular class of measurement, state, or event in the monitored environment. Many defaults relate to the overall performance of the application or business transaction, such as request load, average response time, or error rate. Others describe the state of the server infrastructure, such as percentage CPU busy or percentage of memory used.
Agents register the metrics they detect with the Tenant. They then report measurements or occurrences of the metrics (depending on the nature of the metric) to the Tenant at regular intervals. You can view metrics using the Metric Browser in the Tenant UI.
Information points are a particular type of metric that enables you to report on how your business (as opposed to your application) is performing. For example, you could set up an information point to total the revenue from the purchase on your website of a specific product or set of products. You can also use information points to report on how your code is performing, for example, how many times a specific method is called and how long it is taking to execute.
You can create extensions that use the machine agent to report custom metrics that you define. These metrics are base-lined and reported in the Tenant, just like the built-in AppDynamics metrics.
As an alternative to using the Tenant UI, you can access metrics programmatically with the AppDynamics APIs.
Baselines and Thresholds
The AppDynamics Platform uses both self-learned baselines and configurable thresholds to help identify application issues. A complex distributed application has a large number of performance metrics, and each metric is important in one or more contexts. In such environments, it is difficult to:
- Determine the values or ranges that are normal for a particular metric.
- Set meaningful thresholds on which to base and receive relevant alerts.
- Determine what is a 'normal' metric when the application or infrastructure undergoes change.
For these reasons, anomaly detection based on dynamic baselines or thresholds is one of the essential features of the AppDynamics platform.
The AppDynamics platform automatically calculates dynamic baselines for your metrics, defining what is 'normal' for each metric based on actual usage. Then the platform uses these baselines to identify subsequent metrics whose values fall out of this normal range. Static thresholds that are tedious to set up and, in rapidly changing application environments, error-prone, are no longer needed.
You can create health rules with conditions that use baselines, allowing you to trigger alerts or kick off other types of remedial actions when performance problems are occurring or may be about to happen. See Alert and Respond and Health Rules and Dynamic Baselines.
AppDynamics thresholds help you to maintain service level agreements (SLAs) and ensure optimum performance levels for your system by detecting slow, very slow and stalled transactions. Thresholds provide a flexible way to associate the right business context with a slow request to isolate the root cause. See Transaction Thresholds.
Health Rules, Policies, and Actions
AppDynamics uses dynamic baselining to establish what is considered normal behavior for your application automatically. Then you can set up health rules against those standard baselines (or use other health indicators) to track non-optimal conditions. A health rule might be, for example, to create a critical event when the average response time is four times slower than the baseline.
Policies that allow you to connect such problematic events (such as the health rule critical event) with actions that can trigger alerts/remedial behavior addresses the system's issues long before your users will be affected.
AppDynamics supplies default health rules. You can customize the default health rules and create new rules specific to your environment.
The out-of-the-box health rules test business transaction performance as follows:
- Business Transaction response time is much higher than normal
Defines a critical condition as the combination of an average response time higher than the default baseline by three standard deviations and a load greater than 50 calls per minute. This rule defines a warning condition as the combination of an average response time higher than the default baseline by two standard deviations and a load greater than 100 calls per minute. - Business Transaction error rate is much higher than normal
Defines a critical condition as the combination of an error rate greater than the default baseline by three standard deviations and an error rate higher than ten errors per minute and a load greater than 50 calls per minute. This rule defines a warning condition as the combination of an error rate greater than the default baseline by two standard deviations and an error rate greater than five errors per minute and a load greater than 50 calls per minute.
For more information, see Alert and Respond.
Infrastructure Monitoring
While Business Transaction performance is typically the focus of a performance monitoring strategy, monitoring infrastructure performance can add insight into underlying factors about performance. AppDynamics can alert you of the problem at the Business Transaction and infrastructure level.
AppDynamics provides preconfigured application infrastructure metrics and default health rules to enable you to discover and correct infrastructure problems. You can also configure additional persistent metrics to implement a monitoring strategy specific to your business needs and application architecture.
In addition to health rules, you can view infrastructure metrics in the Metric Browser. In this context, the Correlation Analysis and Scalability Analysis graphs are useful to understand how infrastructure metrics can correlate or relate to Business Transaction performance.
Integrate and Extend AppDynamics
AppDynamics provides many ways for you to extend AppDynamics Pro and integrate metrics with other systems. The AppDynamics Exchange contains many extensions that you can download and if you cannot find what you need, you can develop your own.
AppDynamics Extensions are available in the following categories:
- Monitoring Extensions add metrics to the existing set of metrics that AppDynamics agents collect and report to the Tenant. These can include metrics that you obtain from other monitoring systems. They can also include metrics that your system extracts from services that are not instrumented by AppDynamics, such as databases, LDAP servers, web servers, or C programs. To write specific monitoring extensions, see Extensions and Custom Metrics.
- Alerting Extensions let you integrate AppDynamics with external alerting or ticketing systems and create custom notification actions. To learn how to write specialized custom notifications, see Build a Custom Action. Also, see Email Templates and HTTP Request Actions and Templates.
- Performance testing extensions consist of performance-testing extensions.
- Built-in integration extensions are bundled into the AppDynamics platform and only need to be enabled or configured. These include:
To create custom extensions and integration components for AppDynamics, see AppDynamics APIs.